
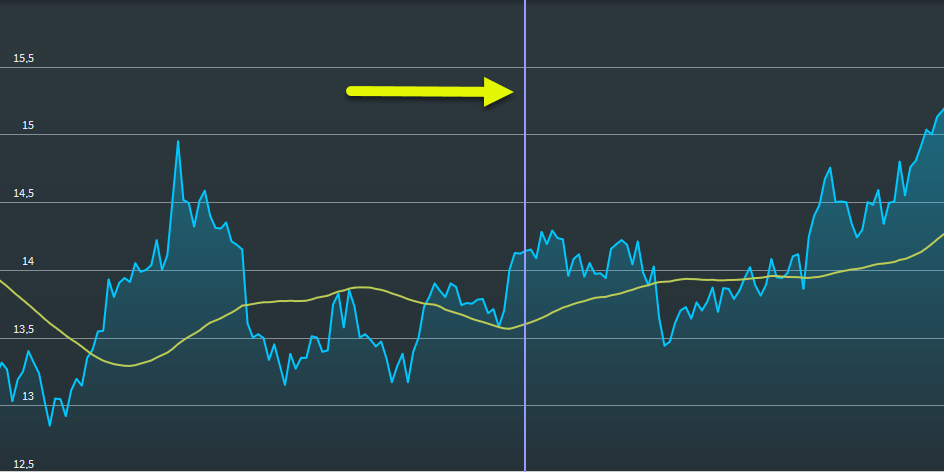
To draw a vertical line, open the menu of the "Lines" button, select the "Vertical line" entry, and then click in the chart.
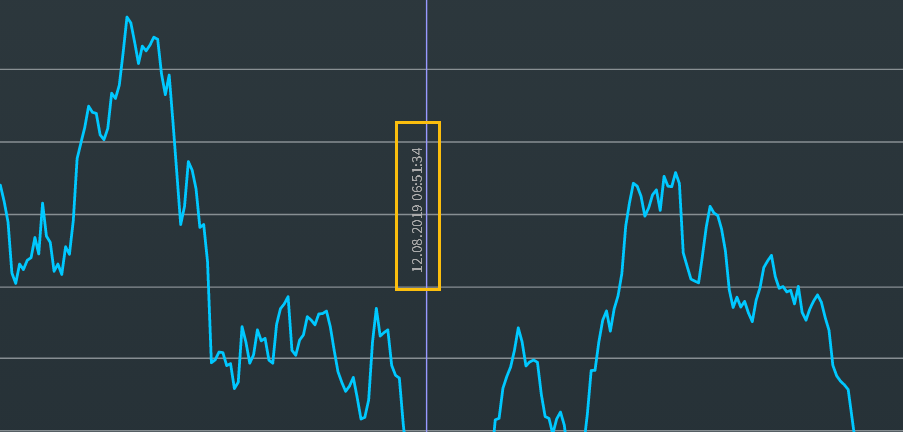
Select the line to move it to the corresponding position. In the properties, you can choose whether to display the date and time or the value of the crossing with the time series on the vertical line:
For more information about working with drawing elements, see Edit drawing elements and Delete drawing elements.