
To draw a horizontal line, open the menu of the "Lines" button, select the "Horizontal line" entry, and then click in the chart.
Select the line to move it to the corresponding position. You can use the properties to hide the value displayed on the horizontal line.
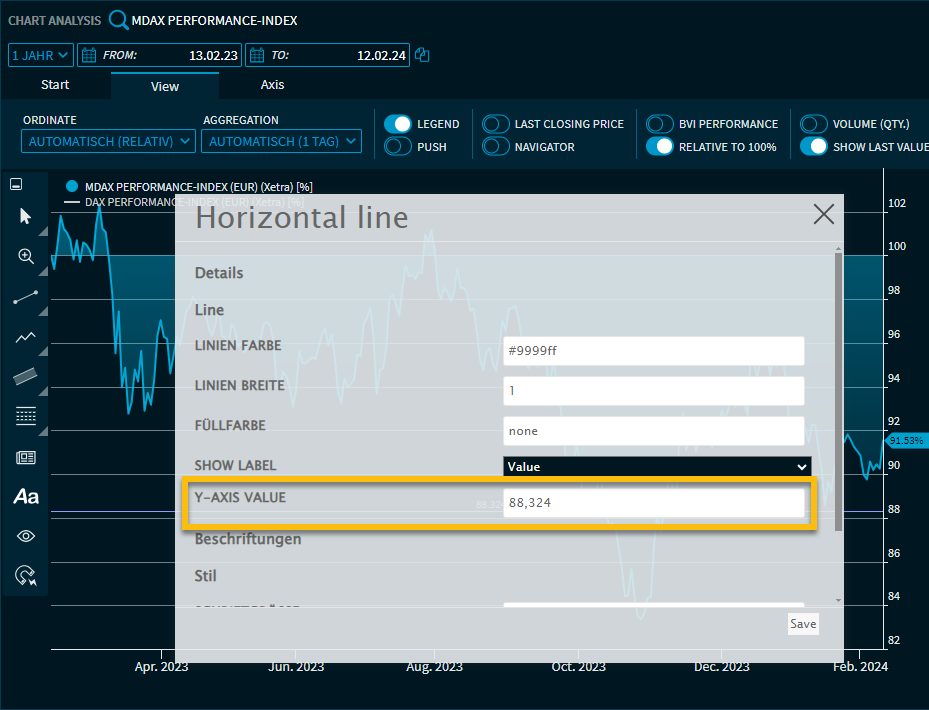
With the "Horizontal line" drawing tool, an exact y-axis value can be entered in the editing dialogue:
For more information about working drawing elements, see and .