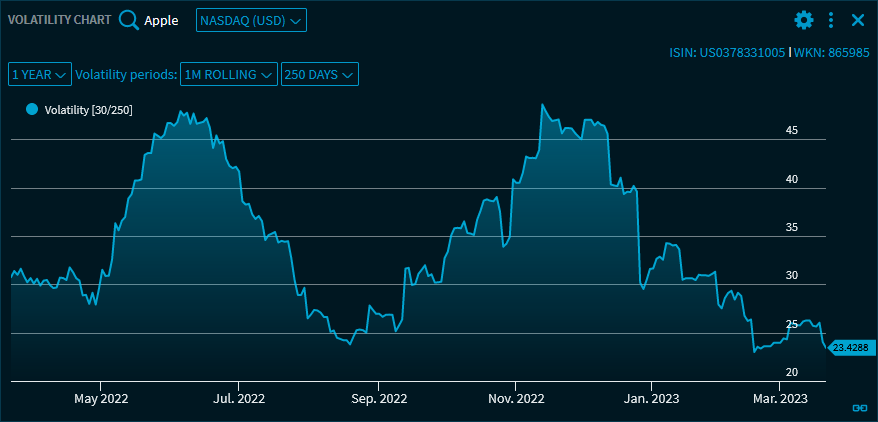
With the "Volatility Chart" widget, you can visualise the historical volatility.
Use the drop-down list in the upper part of the "Volatility Chart" widget to select from the following settings:
|
Element |
Description |
|---|---|
|
"Instrument search" icon |
Use the integrated quick search to search for the security to be displayed. After selecting a security, the name is displayed at the top left of the widget. |
|
Select trading venue |
You find the trading venue drop-down list next to the security drop-down list. Select the trading venue. |
|
"Period" drop-down list |
Below you will find the period selection. Select from the following periods:
|
|
Volatility periods |
Select the calculation periods. The following choices are available:
In addition, you can exactly specify the number of trading days per year in the calculation:
The specified periods are then shown in the drop-down list and in the legend (in brackets). |
|
Icon “Copy chart to clipboard" |
Click this Icon to copy the chart to the clipboard. |
By using the widget's menu icon, you can export the charts in the "Volatility Chart" widget to various file formats.
For more information about charts, see Chart.