The "Chart Analysis" widget is a powerful tool for technical chart analysis.
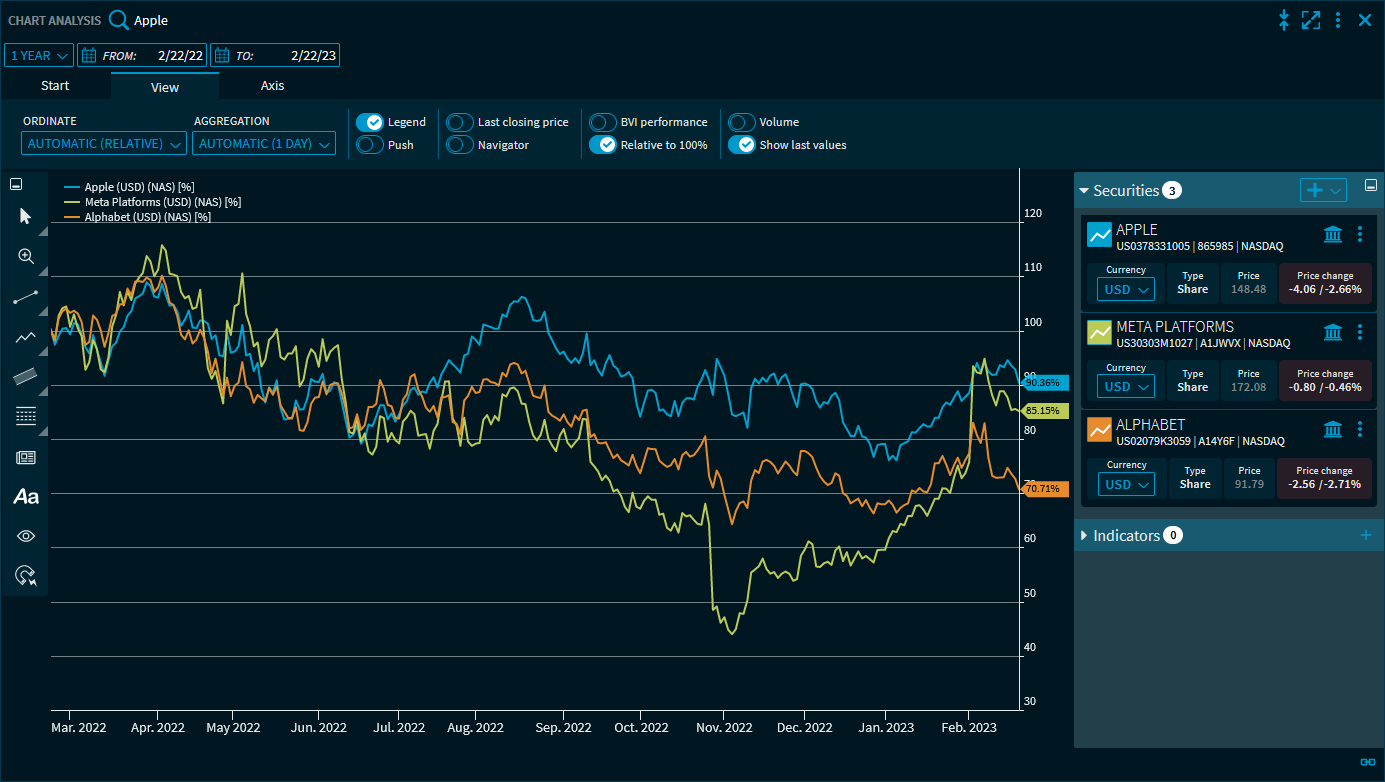
In addition to the functions for the standard chart widgets described in (50-en) Chart, this chart analysis tool offers many additional helpful functions.
The "Chart" widget has the following elements and functions:
|
Element |
Description |
|---|---|
|
Select security |
The selection in the upper left corner of the widget shows the name of the security currently displayed in the chart as default value. Open the menu to select a security. In addition to using the securities search field, you can also select from the previously selected instruments below the search field. The section on the right allows you to add, display and manage instruments for comparison. |
|
"Period" drop-down list |
In addition, you can set the analysis period. Depending on the trading venue, you can select from the following periods:
The "Max." period shows all available prices for the currently selected security. The currently selected dates are displayed in the two input fields "From" and "To". Here, you can also select individual periods using the calendar integrated in the fields: 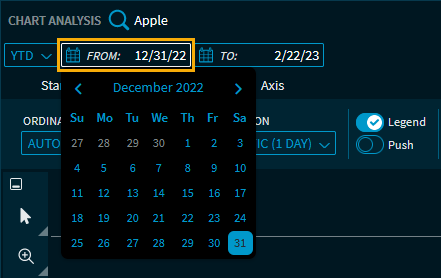
The period selection shows the "Custom" entry for manually changed data. You can also select ‘Today’ for the to date in the chart widgets. In this case, the chart is then automatically displayed up to the current date when the Infront Investment Manager is started on a later day. To manually select the appropriate aggregation for your time period settings, see (50-en) Settings on the "View" tab. |
|
Icon “Copy chart to clipboard" |
Click this icon to copy the chart to the clipboard. |
|
"Start" tab |
Above the chart, you find the "Start" and "View" tabs. By default, the "Start" tab is selected, providing the following functions: |
|
"View" tab |
Switch to the "View" tab to use the following functions:
For more information about these the settings, see (50-en) Settings on the "View" tab. |
|
"Axis" tab |
Switch to the "Axis" tab to set the display of the y-axis and its labels. See also the section (50-en) Settings on the "Axis" tab. |
|
Hide/show toolbar 
|
You can hide and show the toolbar by using the upper button on the left side of the chart window. Similarly, on the right side of the widget, you will find a button to show and hide the bar for securities and indicators. |
|
Cursor |
With this button, you can choose between different display forms of the cursor:
|
|
Zoom |
With this button, you can choose between different zoom types:
|
|
Lines
|
Display lines. See also the section (50-en) Show drawing elements. |
|
Curved lines
|
Display curved lines. See also the section (50-en) Show drawing elements. |
|
Advanced
|
Display further drawing elements. See also the section (50-en) Show drawing elements. |
|
News search
|
This button allows you to quickly start a news search for the (default) security in the chart. See also the section (50-en) Start news search from the chart. |
|
Name
|
Display labels. See also the section (50-en) Show drawing elements. |
|
Show or hide annotations
|
Show or hide annotations specified in the chart. See also the section (50-en) Show drawing elements. |
|
Magnetic drawing tools |
Show or hide magnetic drawing tools. See also the section (50-en) Magnetic tools. |
|
Select security |
The section on the right allows you to add, display and manage instruments for comparison. See also the section (50-en) Show and manage securities. |
|
Indicators |
At the bottom of the securities selection window, you will find the technical indicators for chart analysis. See also the section (50-en) Indicators in the "Chart Analysis" widget. |
|
Legend |
In the legend, you see all time series of the chart window, the colours are assigned accordingly. Clicking a time series hides it from the chart. You can move the legend by dragging it. You can remove displayed benchmarks or indicators from the legend: Point to the legend entry you want to remove. This displays a remove icon behind it, which you can use to quickly remove this chart line. 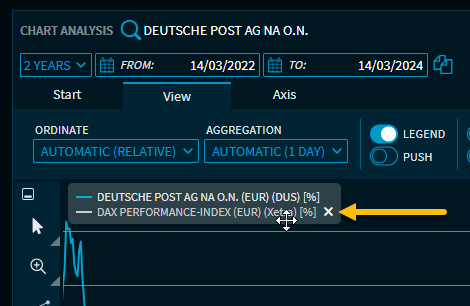
|
|
Export |
By using the widget's menu icon, you can export the charts in the "Chart Analysis" widget to various file formats. |


-
Settings on the "View" tab -
Settings on the "Axis" tab -
Select chart type and colour of the time series -
Save "Chart Analysis" widget data as file -
Export "Chart Analysis" widget data to CSV file -
Indicators in the "Chart Analysis" widget -
Show drawing elements -
Show and manage securities -
Zoom function in the "Chart Analysis" widget -
Start news search from the chart -
Settings in the "Chart analysis" widget