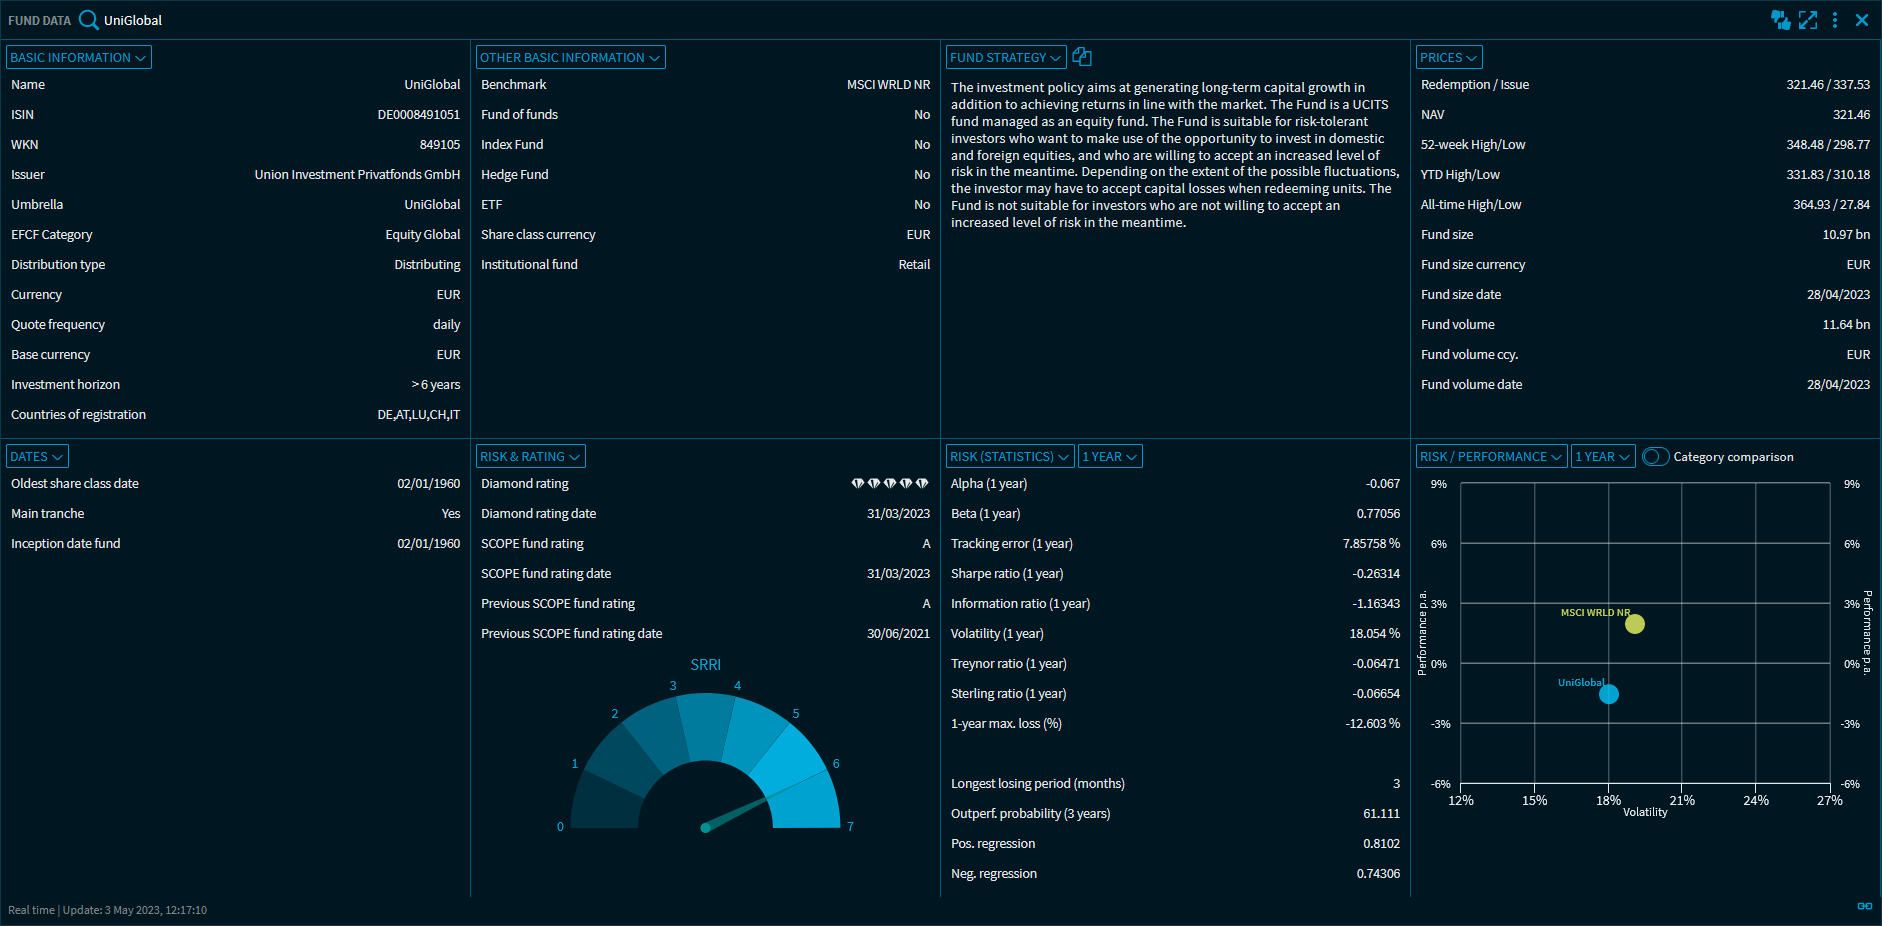
At the top of the "Fund Data" widget, use the integrated quick search to select the desired fund.
With the corresponding activation, the widget "Fund data" with the following views for the analysis of funds is available to you:
-
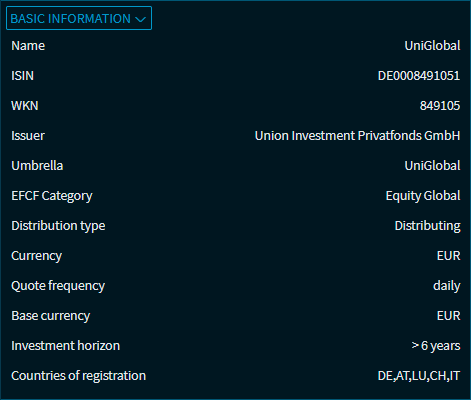
Basic information
-
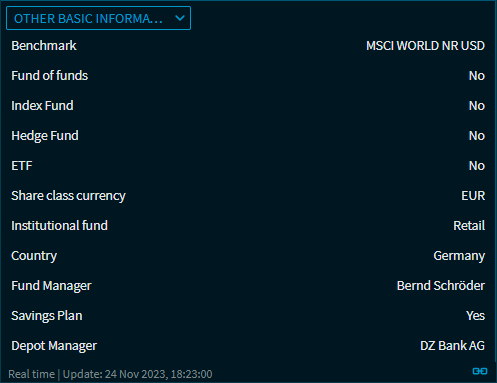
Other master data
-
Investment strategy
-
Prices
-
Dates
-
Ratings
-
Risk assessment
-
Risk performance chart
-
Costs
-
Breakdowns (various, depending on fund type):
-
Breakdown - Currency
-
Breakdown - Geographical
-
Breakdown - Industry
-
Breakdown - Participations
-
Breakdown - Type
-
Breakdown - Duration
-
Breakdown - Rating
-
Breakdown - Bonds
-
Breakdown - Issuer
-
-
Performance
-
Annualised returns
-
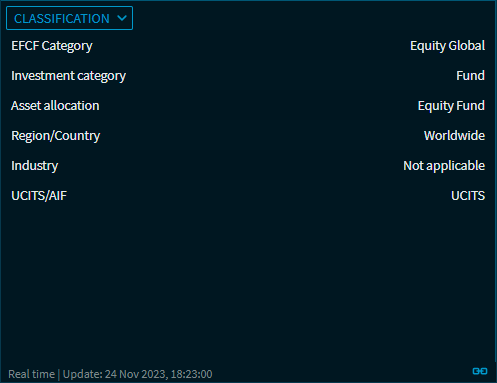
Classifications
-
Share classes
You can select between these views at any time by using the drop-down lists at the top left of each subwindow.
Basic information
Other master data
Investment strategy
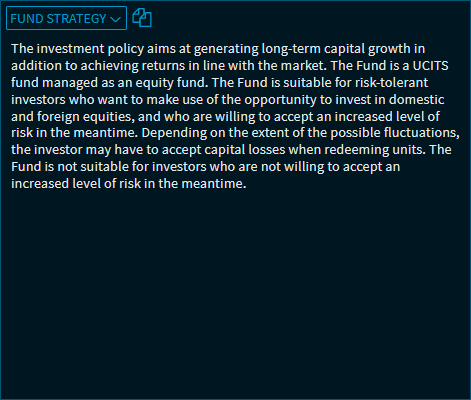
You can use the "Copy to clipboard" icon to copy the text in the "Investment strategy" view and paste it into other applications, for example.
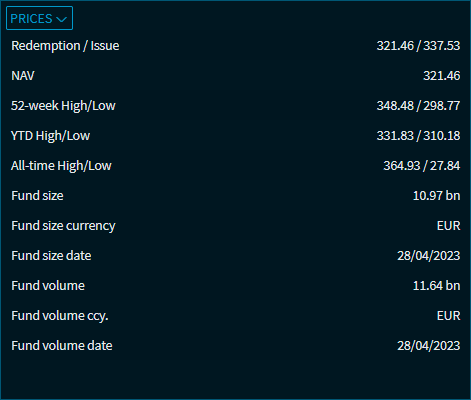
Prices
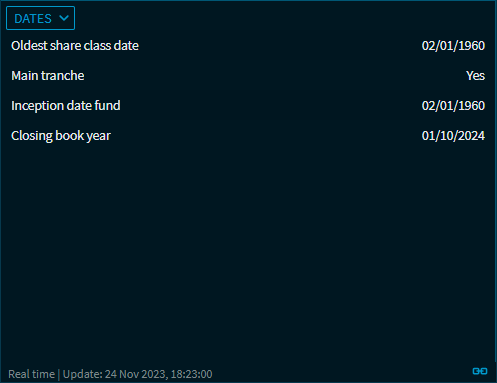
Dates
Ratings
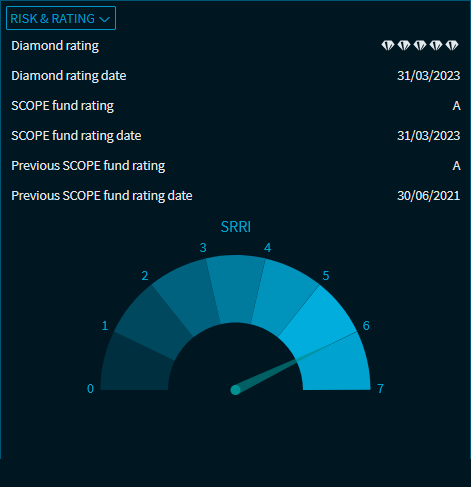
Risk assessment
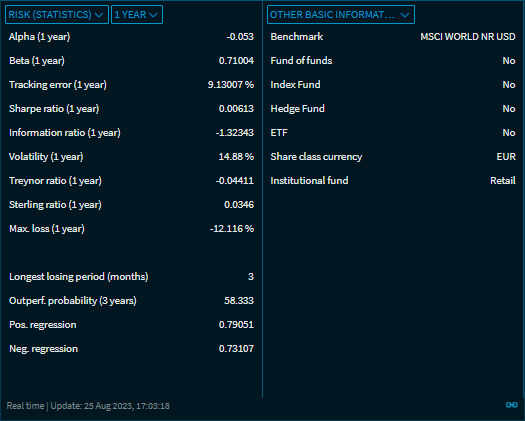
You can select the following periods for the calculation by using the drop-down list in the "Risk (Statistics)" view:
-
1 year (default setting)
-
3 years
-
5 years
Risk performance chart
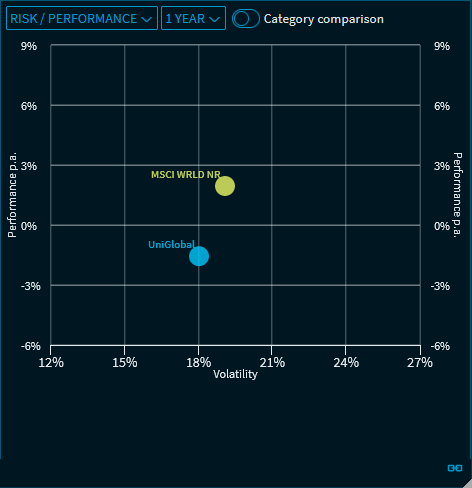
You can select the following periods for the calculation by using the drop-down list in the "Risk / Performance" view:
-
1 year (default setting)
-
3 years
-
5 years
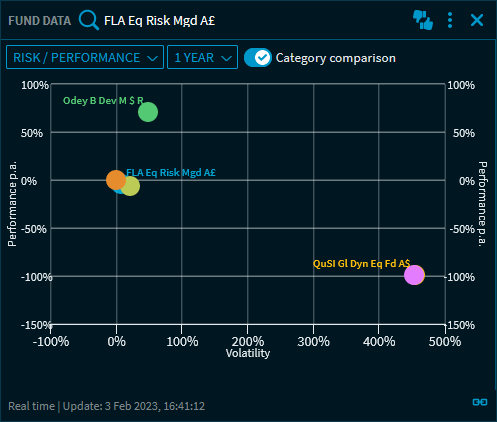
Drag the "Category comparison" button to the right to display the funds with the highest and lowest volatility and performance values in the category:
Costs
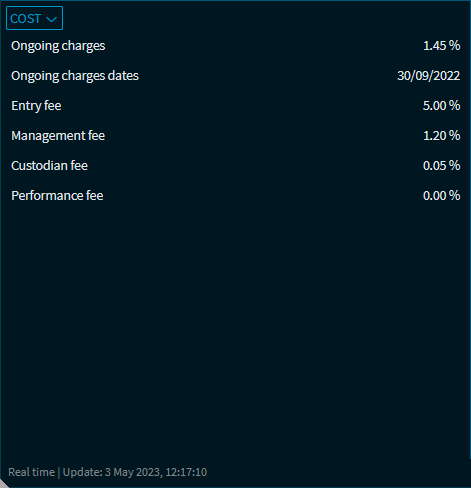
Fields for which no data is available for the currently selected fund are hidden. Possible costs:
-
Instrument with fair value
-
Ongoing charges
-
Ongoing charges dates
-
Front-end load
-
Exit fee
-
Management fee
-
Securities account fee
-
Changing fee
-
Performance fee
Fund Structure
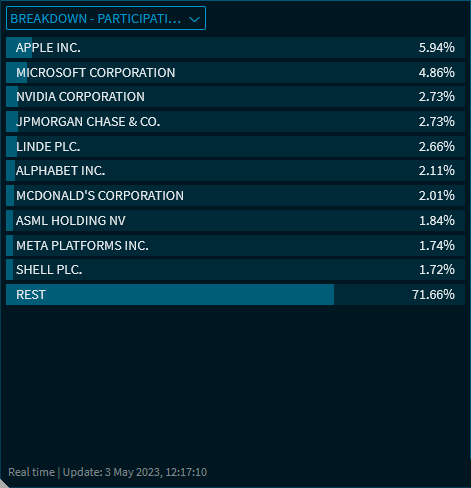
For example, depending on the fund type, you can display the following breakdowns:
-
Currency
-
Regions
-
Sectors
-
Investments
-
Asset classes
-
Duration
-
Ratings
-
Bonds
-
Issuers
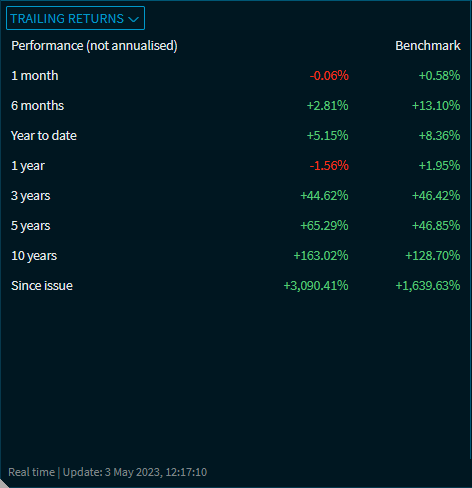
Performance
Annualised returns
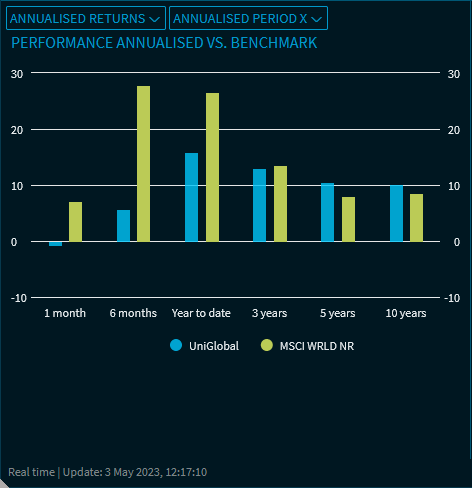
You can select the following entries for the chart by using the drop-down list in the "Annualised returns" view:
-
Trailing yield (default setting)
-
Annualised returns
Classifications
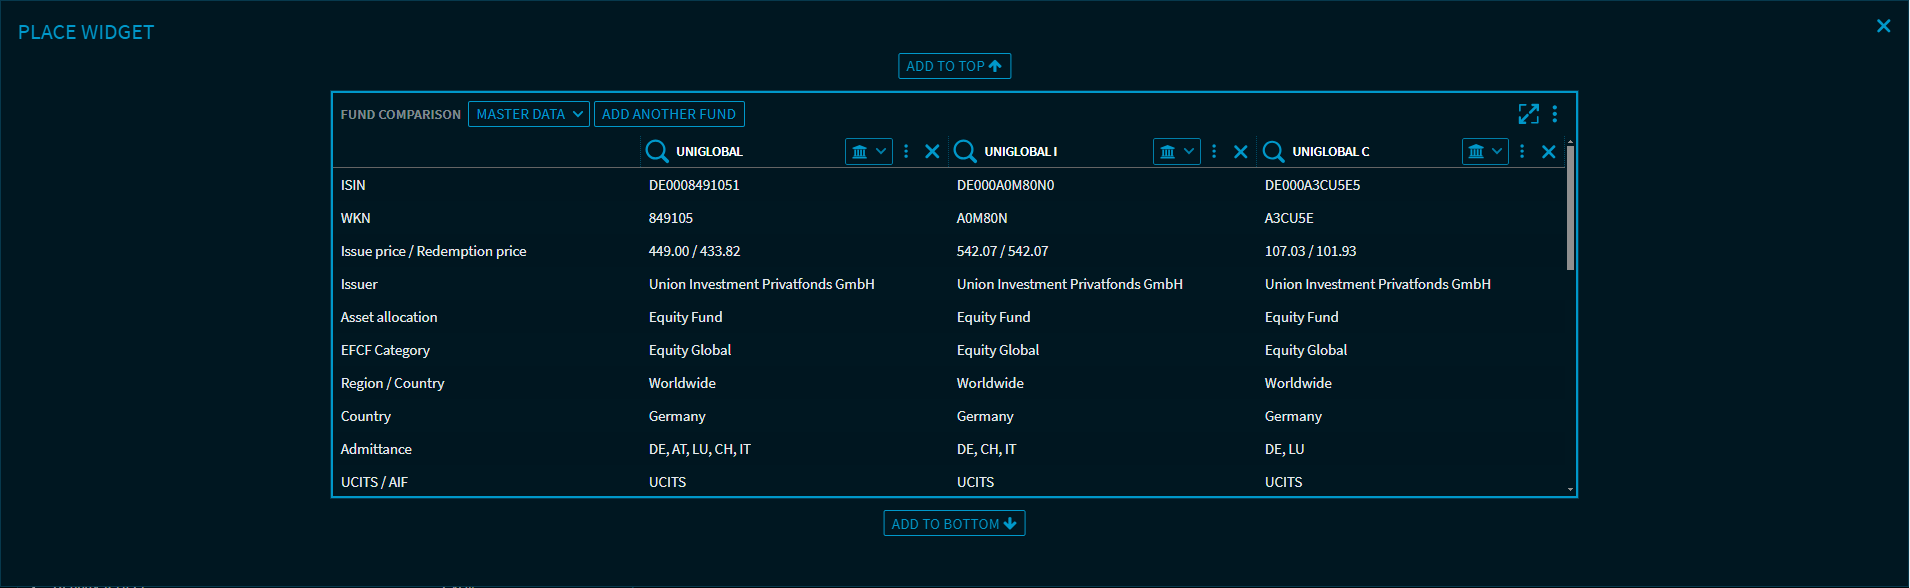
Share classes
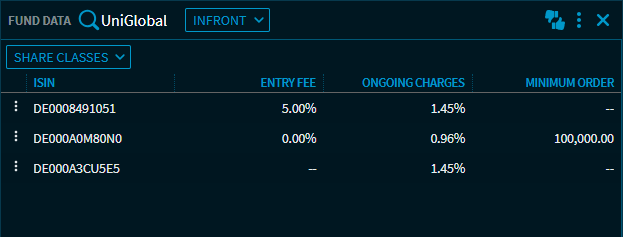
Many investment funds are offered in different share classes. These are units in the same fund. Share classes can differ, for example, in the use of income ("distributing" vs. "accumulating"), the amount of the front-end load or the minimum investment amount. Each share class has its own WKN and ISIN. In this view, you can see the columns "ISIN", "Entry fee", "Ongoing charges" and "Minimum order" for the alternative share classes for the currently selected fund.
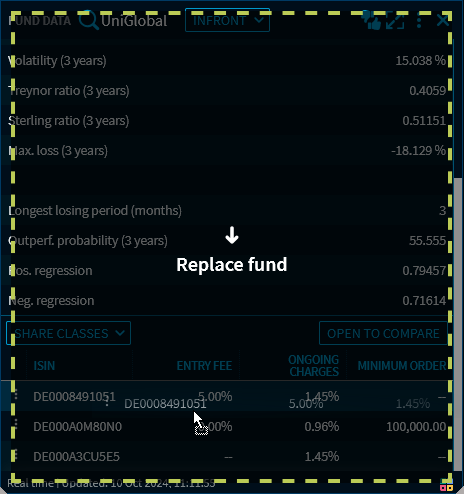
You can drag and drop individual instruments from the "Share classes" view into other widgets (e.g. ‘Fund Comparison’ widget).
The "Open to compare" button is also available.
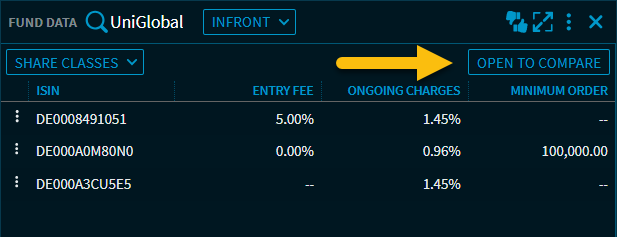
Select this button to open a "Fund comparison" widget in overlay mode for the instruments displayed in the "Share classes" view, which you can place on your dashboard as usual.