This widget features a world map allowing you to quickly find the most important index and its current performance for each country. Point to the country of your choice to see the current performance of the index.
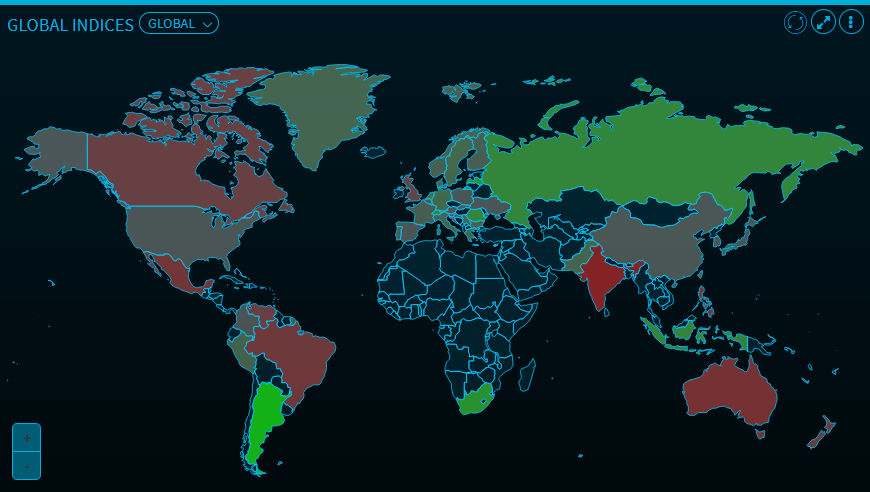
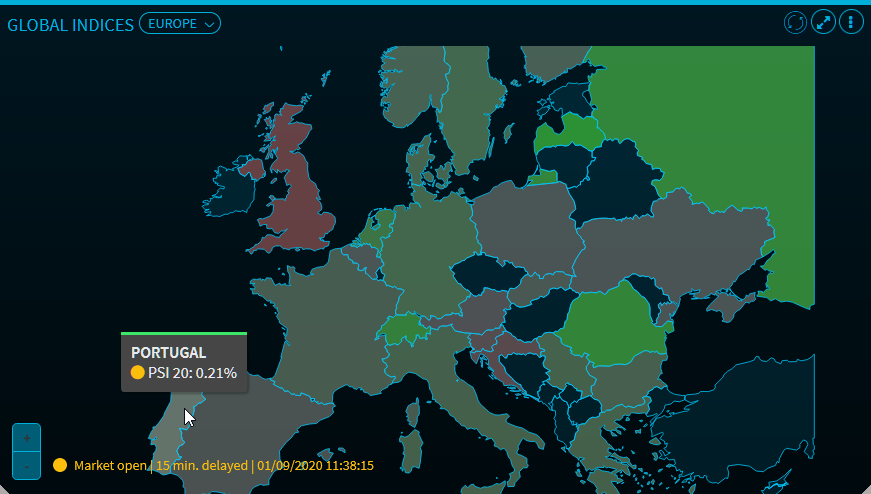
Use the button in the upper left corner to change the region:
-
Global (default)
-
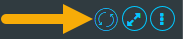
Europe
-
Asia
-
North America
-
South America
-
Australia
|
|
Use the plus and minus icons in the lower left corner to zoom in or out. If you cursor is in the "World Map widget", you can also use the mouse wheel or double-click. |
The colour of the country (here: green) shows you the current performance of the country (here: PSI 20) compared to the previous day. Use the plus and minus icons in the lower left corner to zoom in or out. When you point with your mouse to Portugal, you see the index and the current performance in percent (here -0.54%). If the stock exchange is open as shown in the example, then this is indicated by a yellow dot (if closed, then white dot) next to the index name and the text and time stamp at the bottom of the widget. Here, you also find real time or delayed information about the index performance changes.
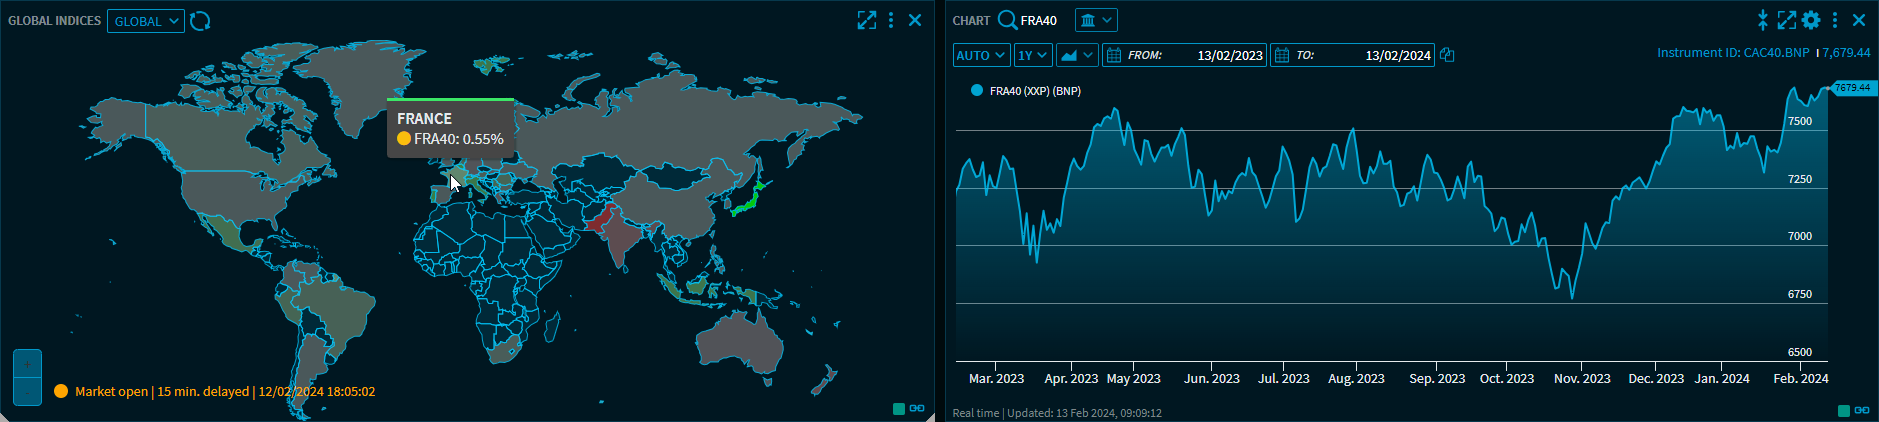
The "Global Indices" widget also supports grouping widgets. For example, clicking on a country displays the corresponding chart for the index in a chart widget.