Infront Investment Manager

Show and manage securities

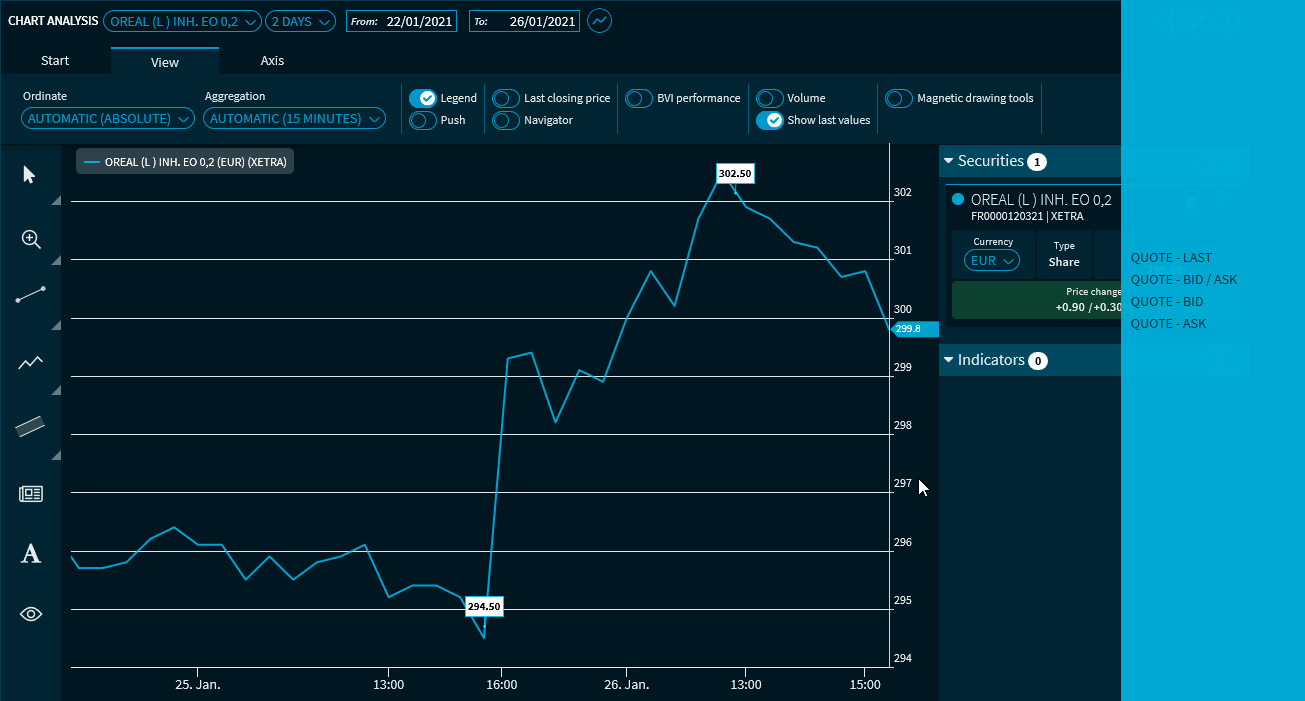
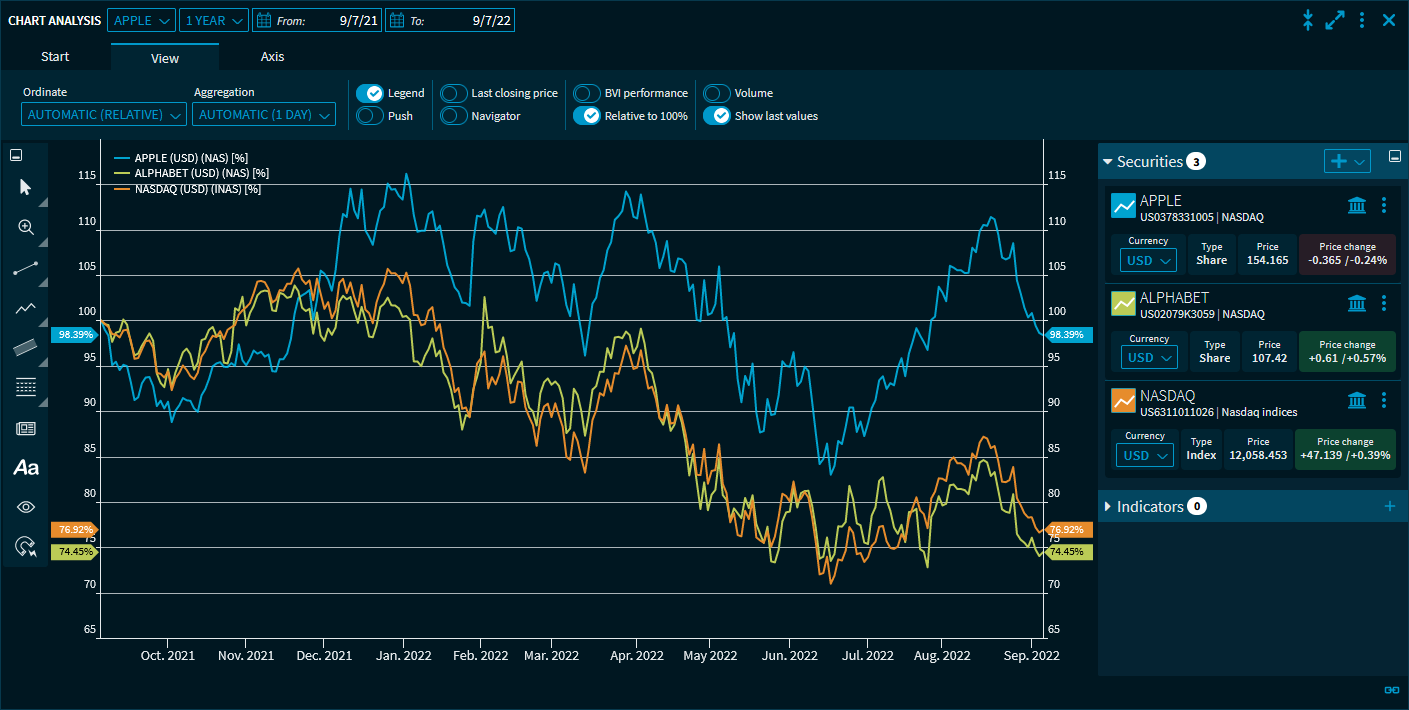
With the securities selection window on the right side of the "Chart Analysis" widget, you can display and manage further instruments to compare against (in addition to the securities selected as standard securities in the widget above). You can also see the most important price and master data for the securities currently displayed here.

chartanalysis_securities_select_EN.png

The following functions are available here:

Element

Description

chartanalysis_securities_show_hide_window_EN.png

Extend or collapse securities selection window

Click the title of the securities selection window to extend or collapse the window.

chartanalysis_securities_number_of_sec_EN.png

Number of currently displayed securities

In the title bar, you see the number of securities currently displayed (even if the securities selection window is closed).

chartanalysis_securities_icon_add_security_EN.png

"Add security" icon

Click this icon on the far right of the title bar in the securities selection window to add a security via the appearing

Search

.

Chart type and colour selection

chart_analysis_icon_settings_EN.png

Click the "Settings" icon to the left of the security name to choose a different colour or chart type for the price time series of this security in the chart from the drop-down list that appears.

For more information, see Show and manage securities.

Select currency

Select the corresponding currency for the instrument from the drop-down list on the left.

You can also select a different currency for indices if corresponding reference currencies are specified.

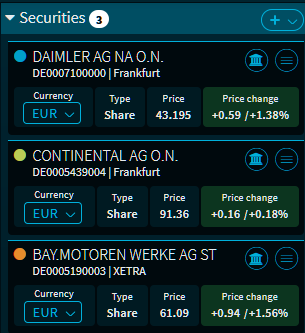
Security information

The securities selection window offers the following details for each security in the chart:

  • Name

  • ISIN, WKN, symbol, valor

  • Trading venue

  • Currency

  • Security type

  • Price
    For suitable security types (for example bonds), you can choose between "price" and "yield" for this price indication:
    chartanalysis_select_price_or_yield_bonds_EN.png

  • Absolute and relative price change compared to previous day's closing
    These details are also highlighted in green if the sign is positive or in red if the sign is negative, as is usual with many other widgets.

You can define the order of the ISIN, WKN, symbol and valor in the user settings for each tenant.


chartanalysis_securities_icon_select_trading_venue_EN.png

Select trading venue

Click this icon of a security in the securities selection window to select another trading venue from the menu that appears.

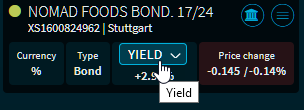
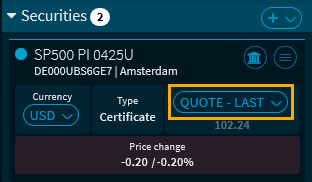
Quote type selection

If you have selected an intraday period, you can also select the quotate type for the chart display for suitable securities.

chartanalysis_securities_quote_select_EN.png

The following options are available:

  • Price (default setting)

  • Bid/Ask

  • Bid

  • Ask

IM_ta_geld_brief_kurs_v22_EN.png

chart_analysis_button_sec_bar_EN.png

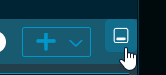
Hide/show security selection window

You can hide and show them by using the top button of the bar on the right-hand side.

chart_analysis_menu_icon_EN.png

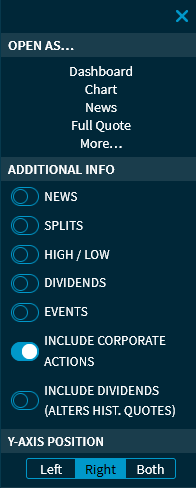
Menu icon of security

chart_analysis_menu_EN.png

Use the menu icon of a security in the security selection window to open a menu that provides you the following functions and additional information:

  • Open as
    This menu item allows you to quickly open the security as a dashboard or in other widgets as you are used to in other menus.

  • Toggle news
    Move the "News" switch to the right to show news for this security in the chart.
    chartanalysis_securities_news_info_EN.png
    News appear as small symbols at the corresponding time in the chart. If you have turned the display of tooltips on, then the news headlines for this date are shown when you point to the symbol:
    chartanalysis_securities_news_info_text_show_EN.png

  • Toggle splits
    Move the "Splits" switch to the right to show splits for this security in the chart.
    chartanalysis_securities_splits_info_EN.png
    Splits appear as small symbols at the corresponding time in the chart. If you have displayed the tooltips, then the split ratio is shown when you point to the symbol:
    chartanalysis_securities_splits_info_text_show_EN.png

  • Toggle highs/lows
    Drag the "High/Low" toggle to the right to show high and low rates on the chart.
    chart_analysis_high_low_EN.png

  • Toggle dividends
    Move the "Dividends" switch to the right to show dividends for this security in the chart.
    chartanalysis_securities_dividends_info_EN.png
    Dividends appear as small symbols at the corresponding time in the chart. If you point to a dividend symbol, a tooltip appears showing the amount of the dividend:
    chartanalysis_securities_dividends_info_text_show_EN.png
    If you click one of the dividend symbols ("D"), all values of the dividends currently available in the chart of this security will be displayed:
    chartanalysis_securities_dividends_show_all_EN.png

  • Toggle dates
    Drag the "Dates" slider to the right to show dates ("Events") of this security (or this company) from the "Exchange Calendar" widget in the chart (disabled by default).
    chart_analysis_appointments1_EN.png
    Displayed events appear as small symbols ("C") at the corresponding time. If you point to an event with the mouse, an info window appears with the details of the event:
    chart_analysis_appointments2_details_EN.png

  • Include corporate actions
    Move this switch to the right to show to include any corporate actions in the chart (enabled by default).

  • Include dividends (alters hist. quotes)
    Move this slider to the right to include the dividends paid in the calculated chart (enabled by default).

  • y-axis position
    Use this command to set the y-axis: "Left", "Right" or "Both".
    chartanalysis_axis_multiple_V36_EN.png
    In the picture above, the values of the y-axis can be read on the left as well as on the right side for the three time series (setting "Both" for y-axis position).

  • Delete
    Select this command to remove this (comparison) instrument from the chart.
    The default security selected at the top of the widget's security selection drop-down list cannot be removed here.


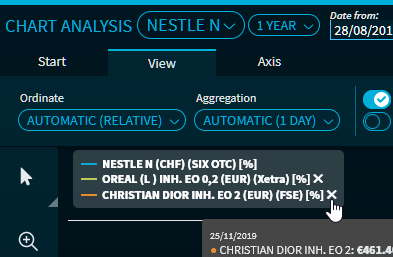
You can temporarily hide the time series of the currently displayed securities in the chart without removing them from the widget. To do this, click the name of the security that you want to hide in the chart legend. Click the entry in the legend again to display the time series.

chartanalysis_hide_security_EN.png

You can also quickly remove displayed benchmarks or indicators from the legend: Point to the legend entry you want to remove. This displays a remove icon behind it, which you can use to remove this chart line.

chartanalysis_delete_legend_entry_EN.png


See also: