You can export the data from the "Chart Analysis" widget (as from many other widgets) as a CSV file. To do this, follow these steps:
-
Go to the "Chart Analysis" widget.
-

-
In the "Export" area, click the CSV" button.
-
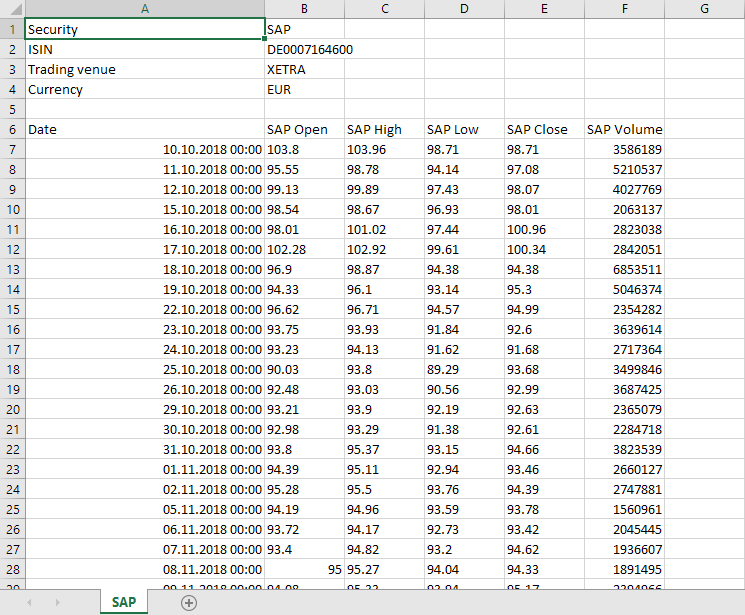
Save the file or open it directly in Excel.
The header shows the following information for each security:
-
Security
-
ISIN
-
Trading venue
-
Currency
The following data is output for the time series of the main instrument:
-
Date
-
OHLC (Open, High, Low, Close)
-
Volume
The closing price is shown for all other instruments.
For each indicator, one column per parameter is displayed with the main instrument (except "colour").