Type
Comparison indicator
Short introduction/statement
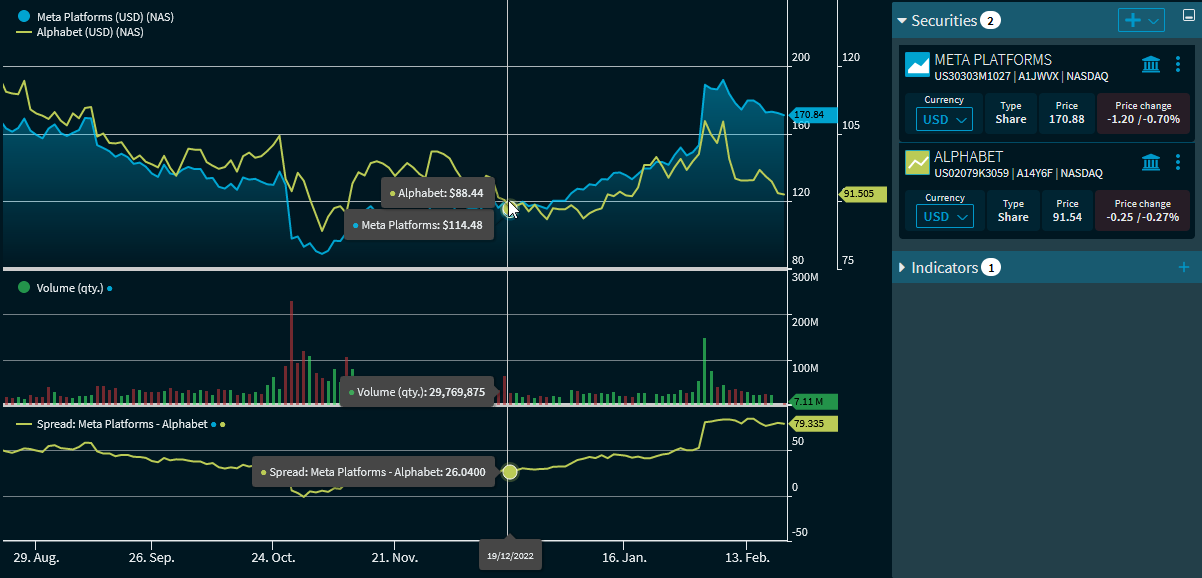
The "Spread" indicator compares two time series by subtracting prices. This means that at least two securities (or at least two time series) must be displayed in the "Chart analysis" widget. In the indicator settings, select the corresponding time series or securities:
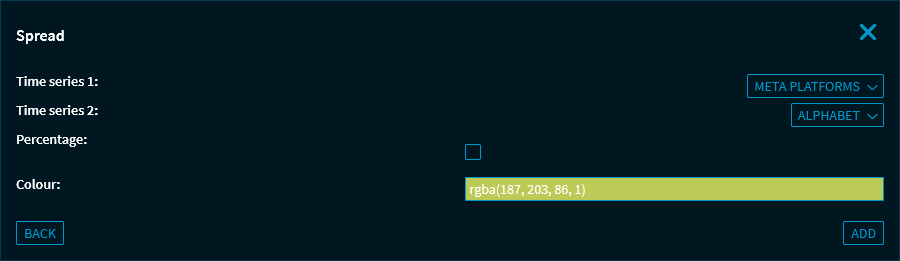
In addition to the time series of the securities, the volume time series can also be selected. You can also use the "Percentage" checkbox to switch to a percentage calculation and display.
Formula/calculation
Spread = TS1 - TS2
where:
TS1 = Time series 1 (1. security or volume)
TS2 = Time series 2 (2. security or volume)