Type
Momentum oscillator
Short introduction
The Coppock curve, developed by Edwin Coppock, is based on Momentum and MA. It is used to identify long-term (multi-year) trends, and rather unsuitable for short-term trends.
Statement
The Coppock curve measures long-term trends by adding two long-term momentums. A weighted MA is formed on the basis of this sum. Because the base of the indicator is formed by momentum, the Coppock curve also oscillates around the zero line.
Formula/calculation
Coppock curve = WMAx(ROCy + ROCz)
where: WMA = Weighted Moving Average (weighted moving average)
Interpretation
The Coppock curve is interpreted in two different ways. In the standard interpretation, the turning of the line above the zero line downward is interpreted as a sell signal. The turning of the line below the zero line upward is interpreted as a buy signal.
Default setting
-
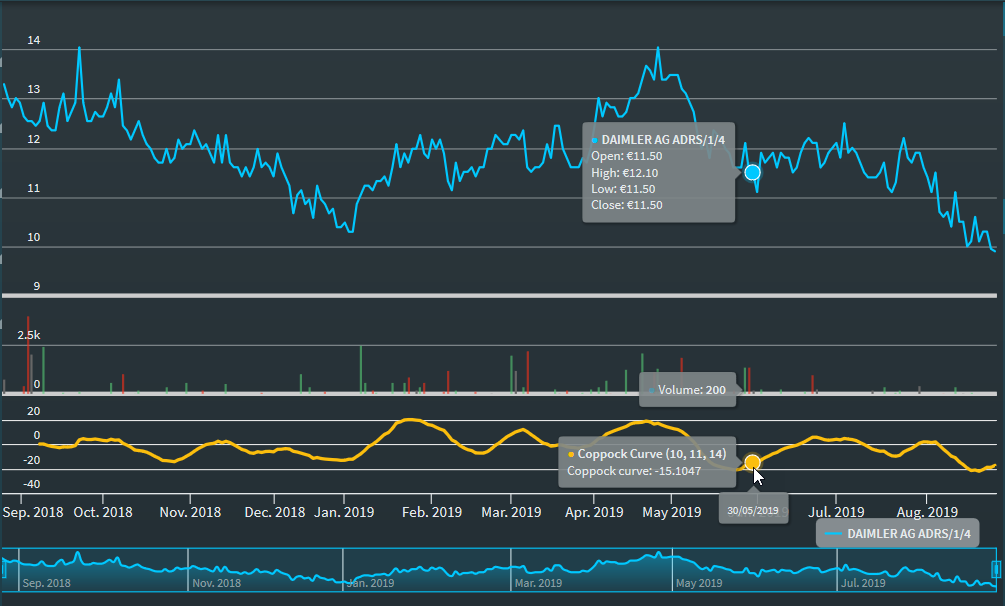
Weighted MA: 10 weeks
-
Short ROC: 11 weeks
-
Long ROC: 14 periods