
-
From the "Fibonacci" button menu, select the "Fibonacci circle" entry.
-
Then click the starting position of the element in the chart.
-
Change the circle to the size you need. Next, click the end point for the radius.
This draws the Fibonacci circle. You can now also select and move it (middle touch point) or drag the outer touch point and enlarge or reduce it.
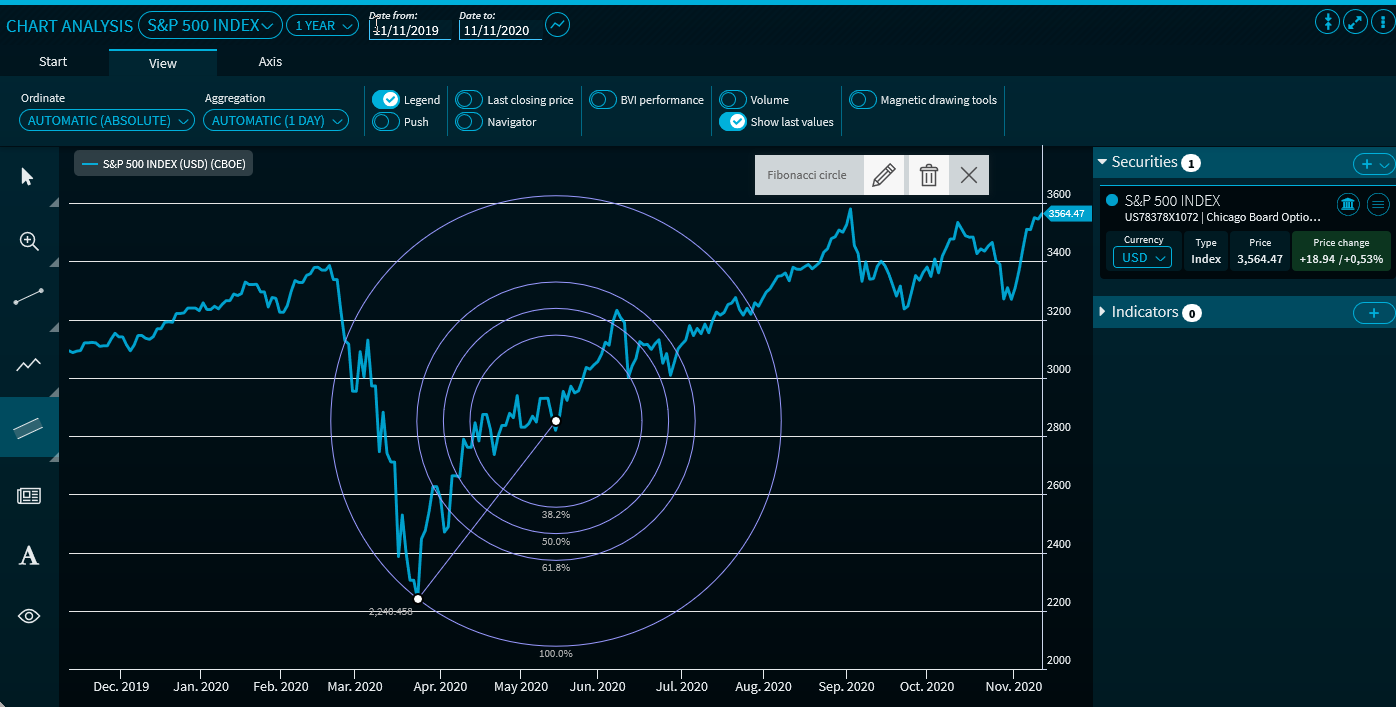
The Fibonacci circles are plotted at 38.2% - 50% - 61.8% - 78.6% - 100%.
For more information about working drawing elements, see Edit drawing elements and Delete drawing elements.