
-
From the "Fibonacci" button menu, select the "Fibonacci horizontal segment" entry.
-
Then click the starting position of the element in the chart.
-
Change the element that appears to the size you need. Click the end point for the segment.
This draws the Fibonacci horizontal segment. You can now select and move it or drag at one of the touch points to make it longer or shorter.
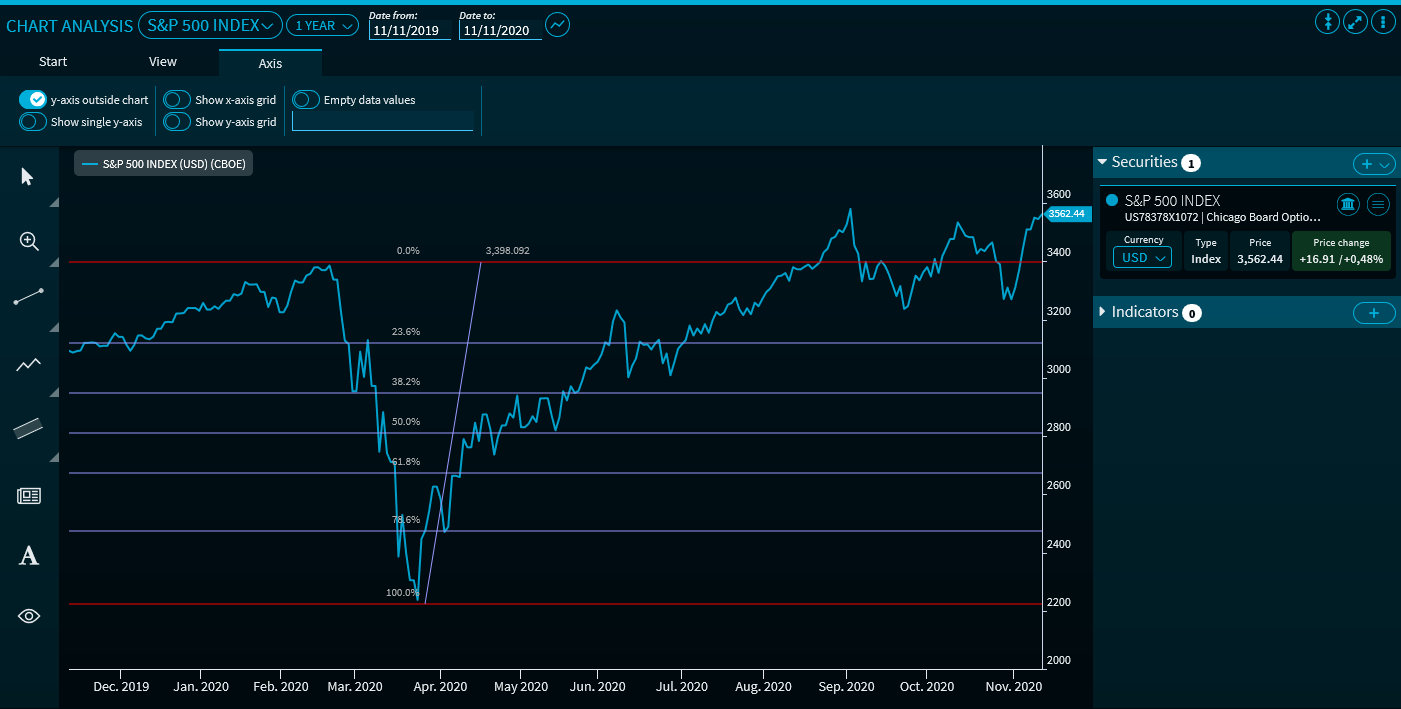
The vertical Fibonacci lines are plotted at 0% - 23.6% - 38.2% - 50% - 61.8% - 78.6% - 100% - 123.6% - 138.2%...
For more information about working drawing elements, see Edit drawing elements and Delete drawing elements.