
-
From the "Advanced" button menu, select the "Ellipse" entry.
-
Then click the starting position of the element in the chart.
-
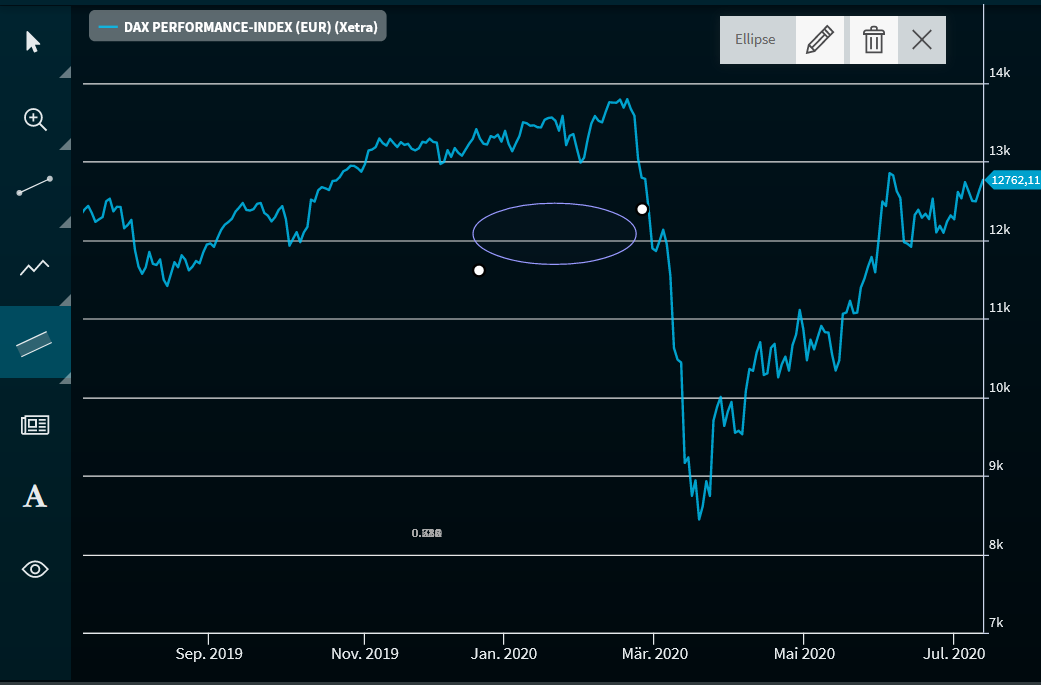
Then, move the ellipse that appears to the corresponding location in the chart.
-
Click the end point to draw the ellipse.
-
You can change the size and shape with the mouse by using the two handles.
For more information about working drawing elements, see Edit drawing elements and Delete drawing elements.