
The popular “Heatmap” view is also available for portfolios and price lists via the view drop-down menu in the header of the widgets.
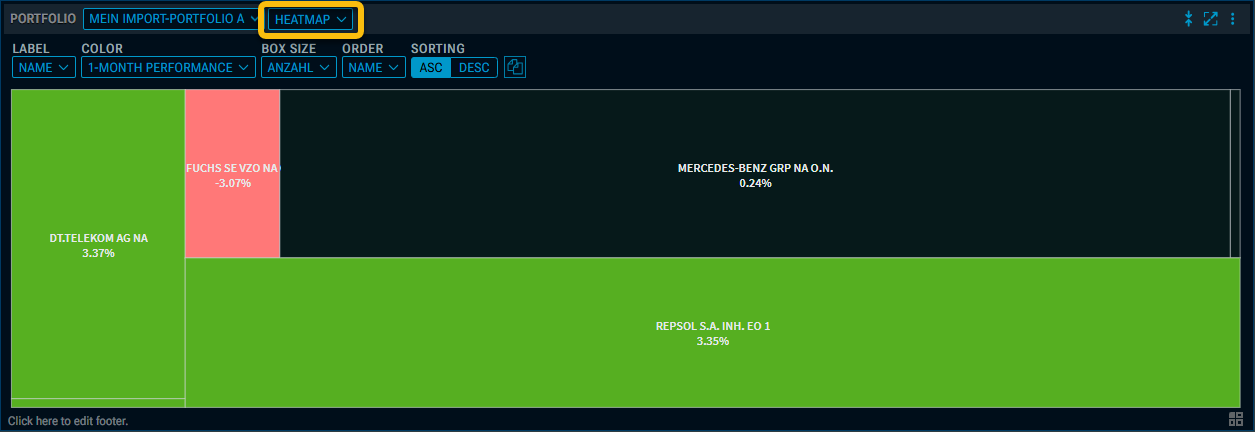
The configuration options above the heatmaps offer a wide range of settings:
|
Element |
Description |
|
Label |
Use this drop-down list to select which label should be displayed in the tiles. You can choose from the following fields:
|
|
Colour |
Use this drop-down list to select the criterion that determines the colour of the tiles. You can choose from the following criteria:
|
|
Box size |
Use this drop-down list to select which field should determine the size of the tiles. You can choose from the following options:
|
|
Order |
Use this drop-down list to specify the display order. You can choose from the following criteria:
|
|
Sorting |
Use the “ASC” and “DESC” buttons to select the sort order. |

Copy chart to clipboard |
Select this icon to copy the heatmap to the clipboard. |
You can also use the EXPORT command in the widget menu to export the heatmap as a JPEG, PNG, SVG or PDF.