Select the "Chart: Other key figures" to show the following key figures of the last 10 years as a table as well as in a chart:
-
Shares outstanding in millions
-
Number of employees
-
Personnel costs
-
Sales per employee
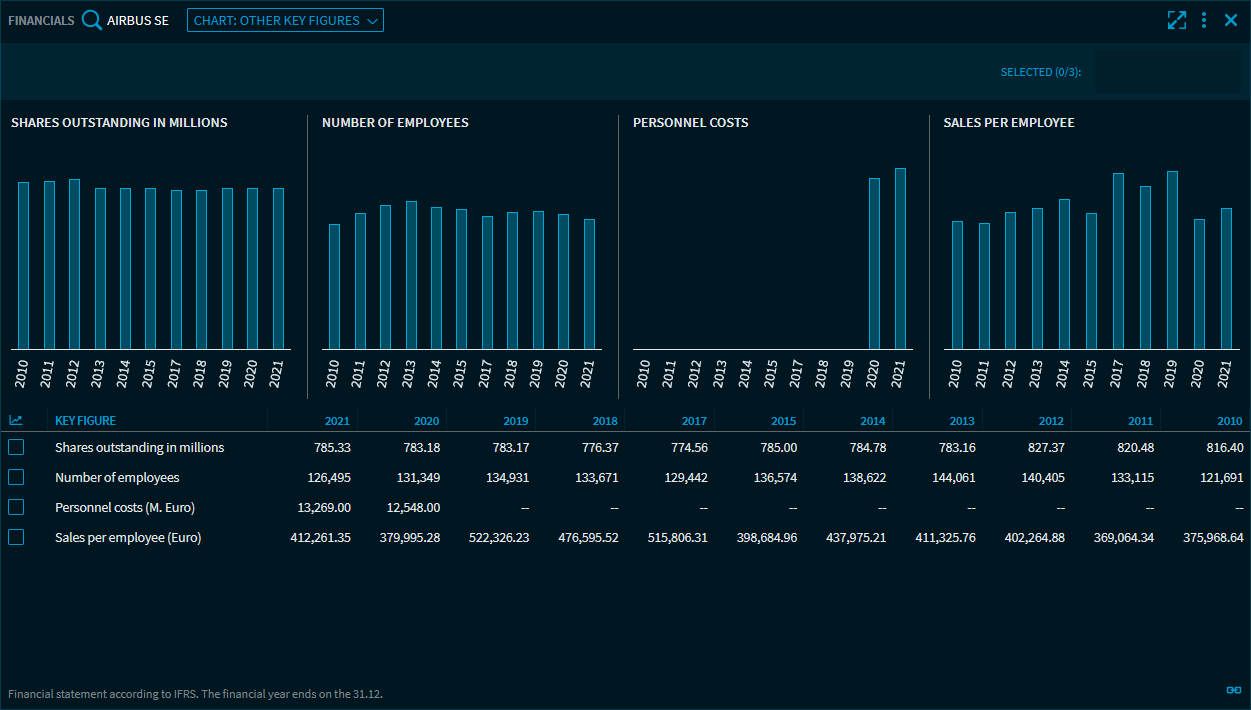
Point to a bar in the bar chart to see the individual values in a tooltip.
Here, too, you can select the key figures in the lower table and display them as separate charts.