Select the "Chart: Fundamental" menu item to see the company's fundamental data for the last 10 years. The following key figures are shown in a table as well as in a chart:
-
Earnings per share
-
Dividend per share
-
Sales per share
-
Cash flow per share
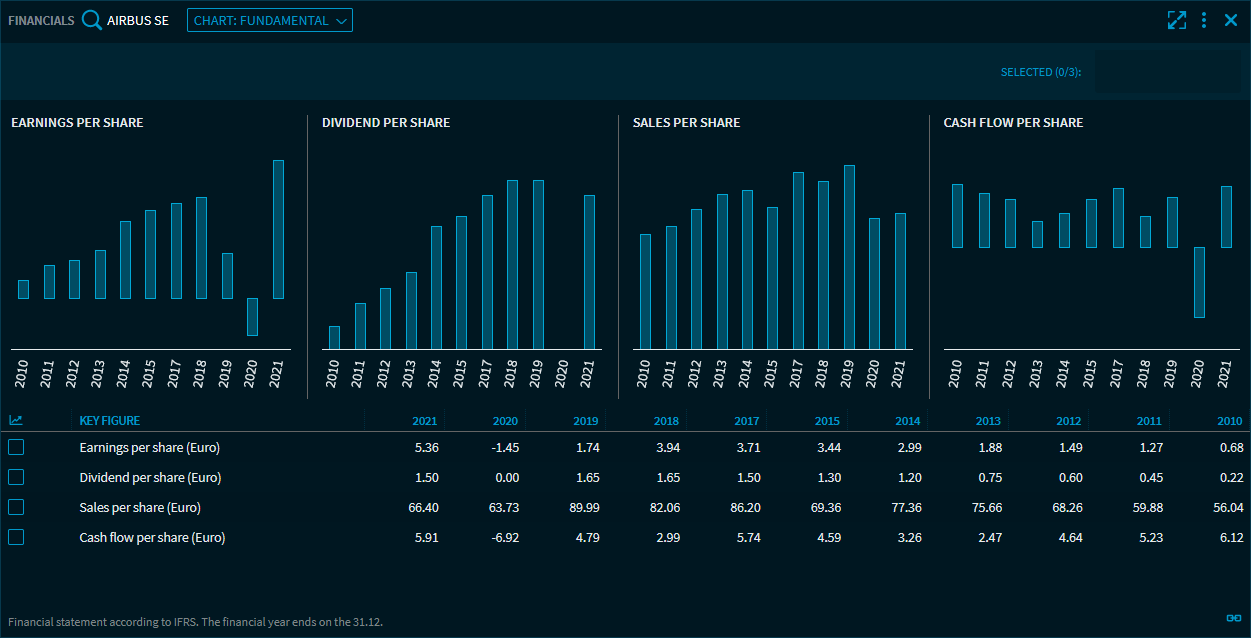
Point to a bar in the bar chart to see the individual values in a tooltip.
Here, too, you can select the key figures in the lower table and display them as separate charts.