Select the "Chart: Profitability" menu item to see the profitability key figures of the last 10 years. The following key figures are shown in a table as well as in a chart:
-
Return on equity
-
Return on sales
-
Total yield
-
Return on investment
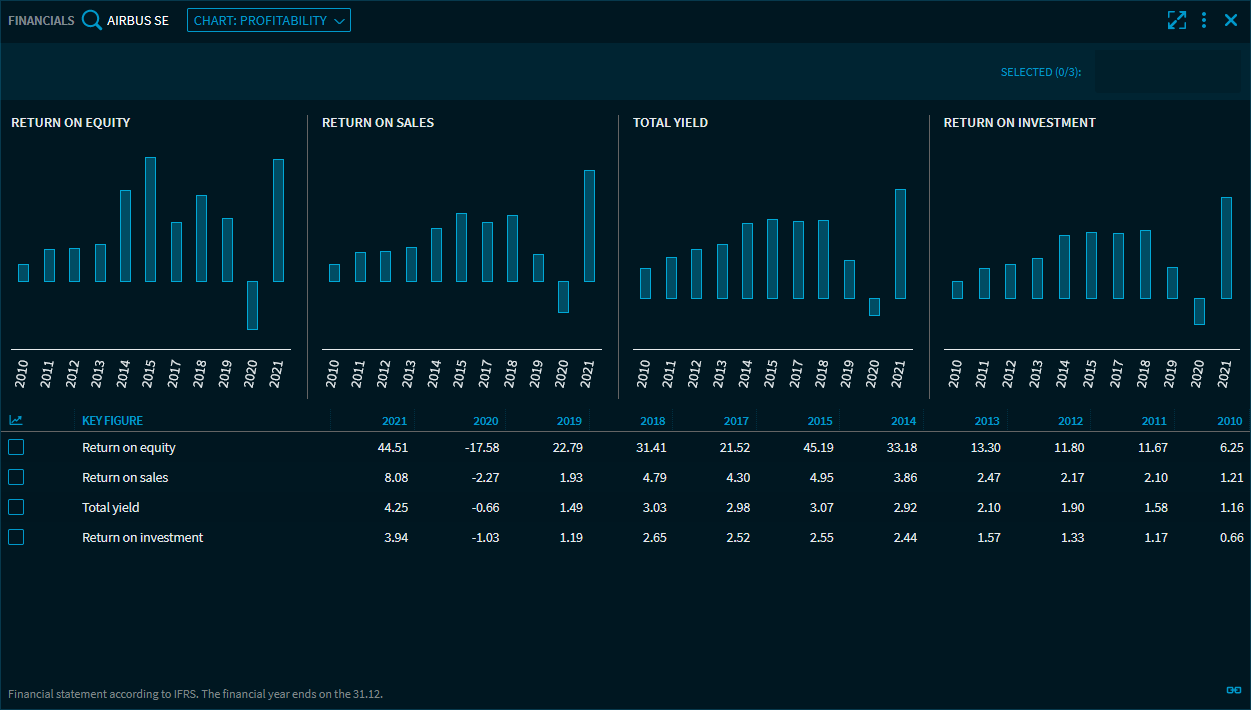
Point to a bar in the bar chart to see the individual values in a tooltip.
Here, too, you can select the key figures in the lower table and display them as separate charts.