In the "Graphic view", all relevant cash flows during the holding period or the term to maturity of the bond are shown graphically. At the top of the graphic view, you find the legend for accrued interest, purchase, coupon payment, repayment and profit.
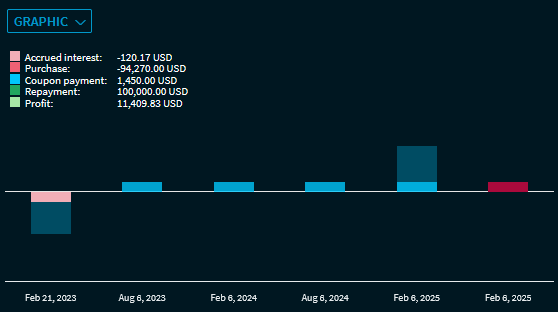
Point to a bar in the graphic to see the exact values at this time.