![]()
Alternatively, you can use the "Settings" command in the widget menu.
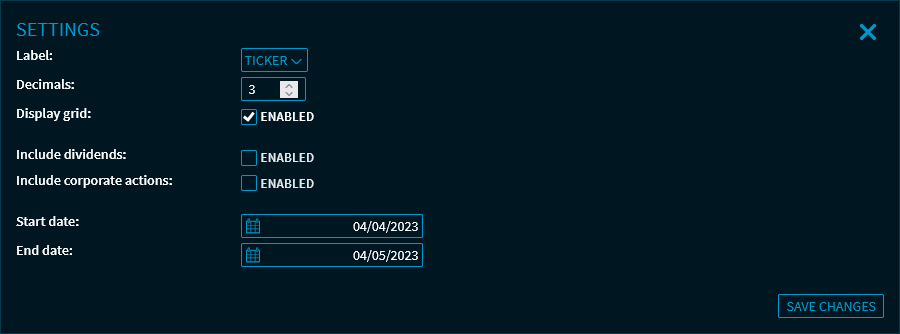
Here, you can make the following settings:
|
Field |
Description |
|---|---|
|
Name |
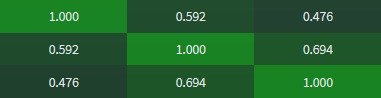
Use the drop-down list to select the labels for the rows and columns of the correlation matrix.
|
|
Decimal places: |
Specify the number of decimals to be displayed in the matrix. You can set 0 to 5 decimals. |
|
Display grid |
Clear this checkbox to hide the grid lines in the correlation matrix: |
|
Include dividends |
Select this checkbox if you want to include the dividends in the correlation matrix. |
|
Include corporate actions |
Select this checkbox to include any corporate actions in the correlation matrix. |
|
Start date |
Enter a custom start date for the calculation. The "Custom" entry in the drop-down list opens the settings dialogue window where you can specify a user-defined start and end date. |
|
End date |
Enter a custom end date for the calculation. The current date is set by default. |
For more information about the widget settings, see Commands in the widget menu.