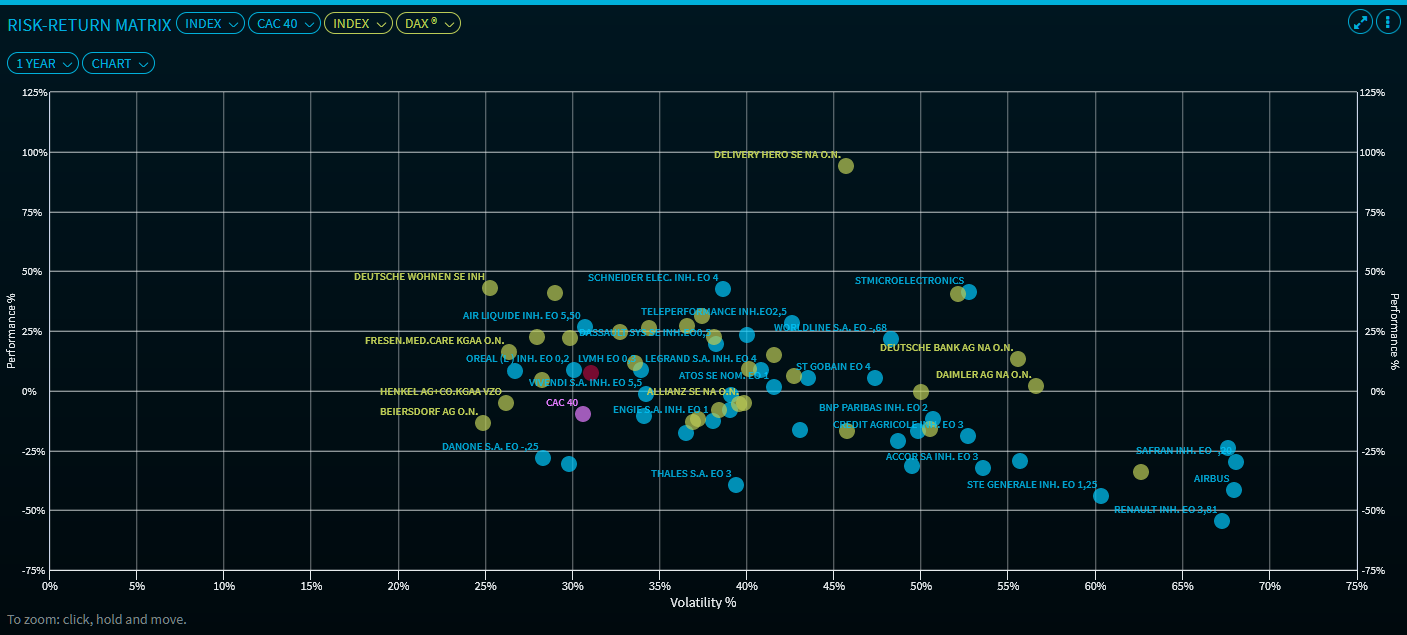
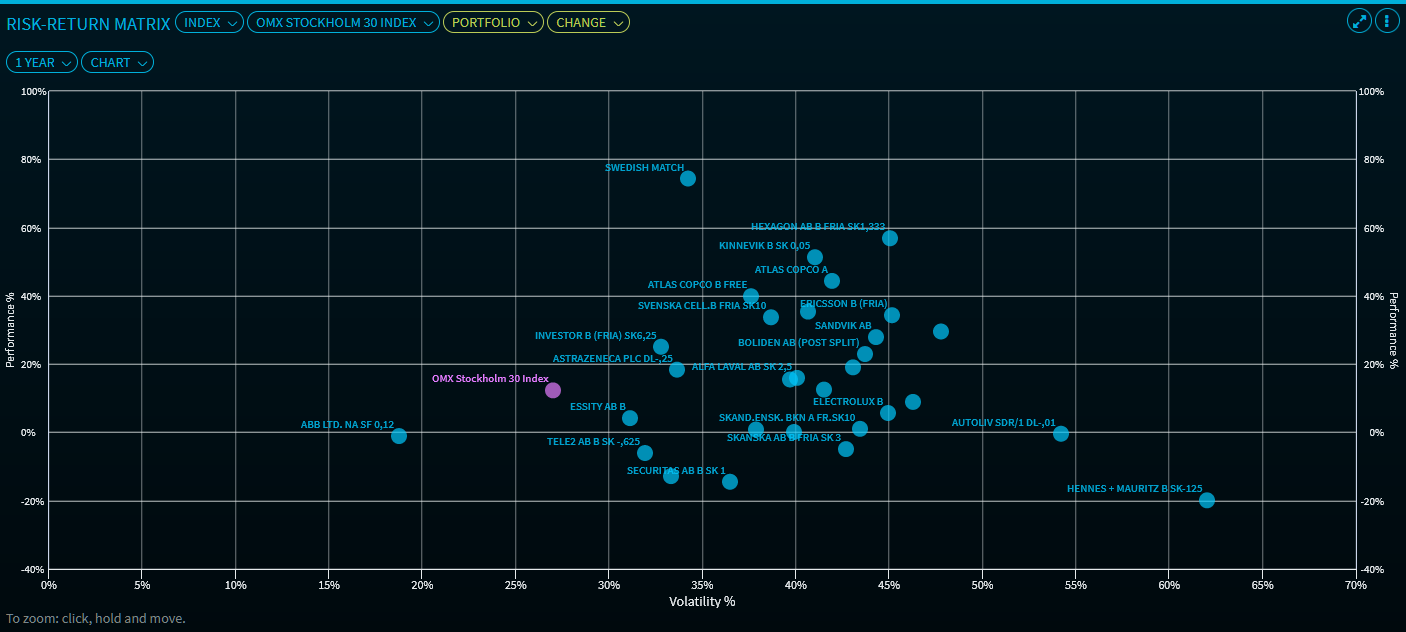
The "Chart" view is the default view of the "Risk-Return Matrix" widget. The securities of the index (or watchlist or portfolio) are displayed as data points in a chart. On the horizontal axis (x-axis), you find the volatility in percent. On the vertical axis (y-axis), you find the performance in percent.
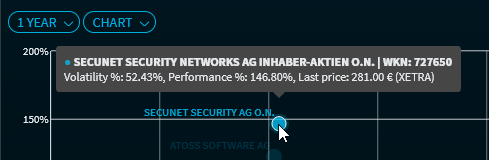
Point to a data point to show the exact values for the security.
If you selected an alternative second index (or watchlist or portfolio), then its securities are shown as data points with a new colour in the chart.