To the right below the input data of the "FX Option Calculator" widget, you see the "Chart" area, where the calculated values are displayed in a chart.
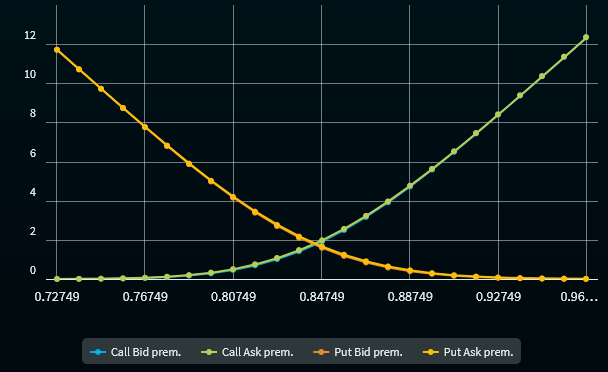
The chart view shows the values from the table in the chart. The x-axis displays the the strike prices. The y-axis displays the prices for the following curves:
-
Call Bid premium
-
Call Ask premium
-
Put Bid premium
-
Put Ask premium
Point to the dots in the Chart to see the exact values.