You can display the spreads calculated in the "Benchmark Bond Spreads Calculator" as charts. To do this, follow these steps:
-
Click a spread value in the matrix.
Below the matrix, you see a chart visualising the spread across the entire period. -
Select further values to display multiple spreads in the chart.
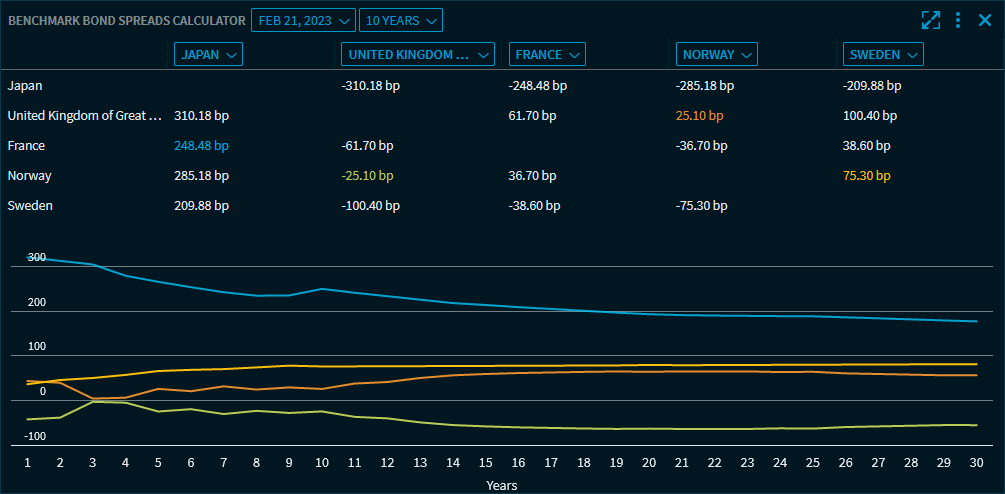
The values in the matrix are colour-coded according to the chart lines. To hide a value in the chart, click it in the matrix once again.