
Share Comparison: Four new views (Improvement – IM-14681)
The “Share Comparison” widget offers a choice of four further views.
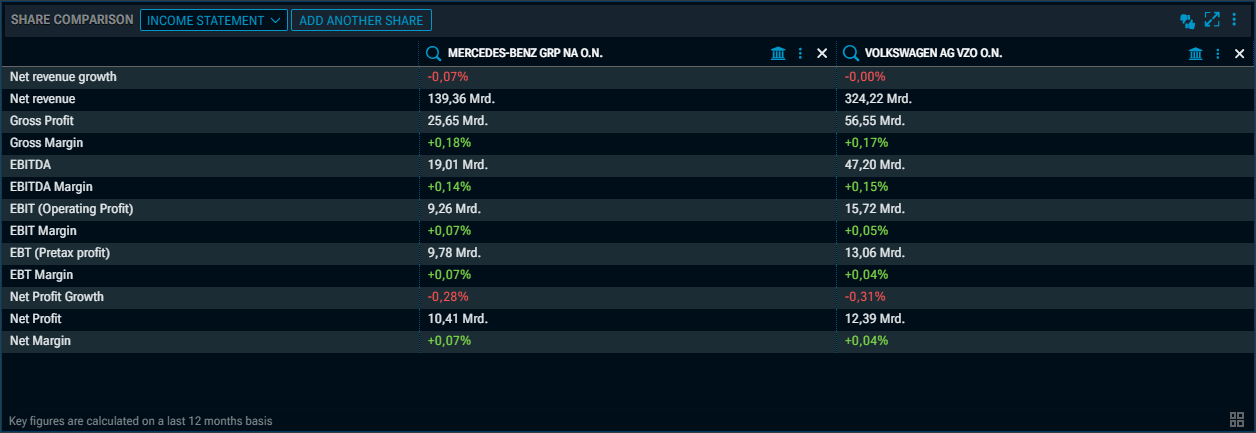
Share Comparison – "Income statement" view
Select the "Income statement" view from the drop-down list at the top to see a comparison of the key financial figures from the P&L:
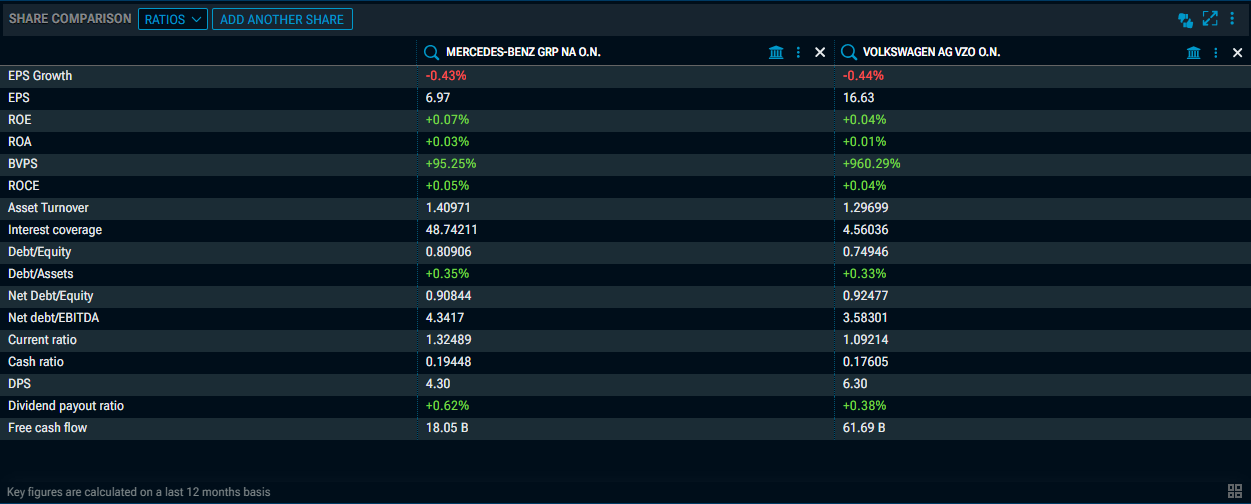
Share Comparison – "Ratios" view
Select the “Ratios” view from the drop-down list at the top to see the following ratios side by side:
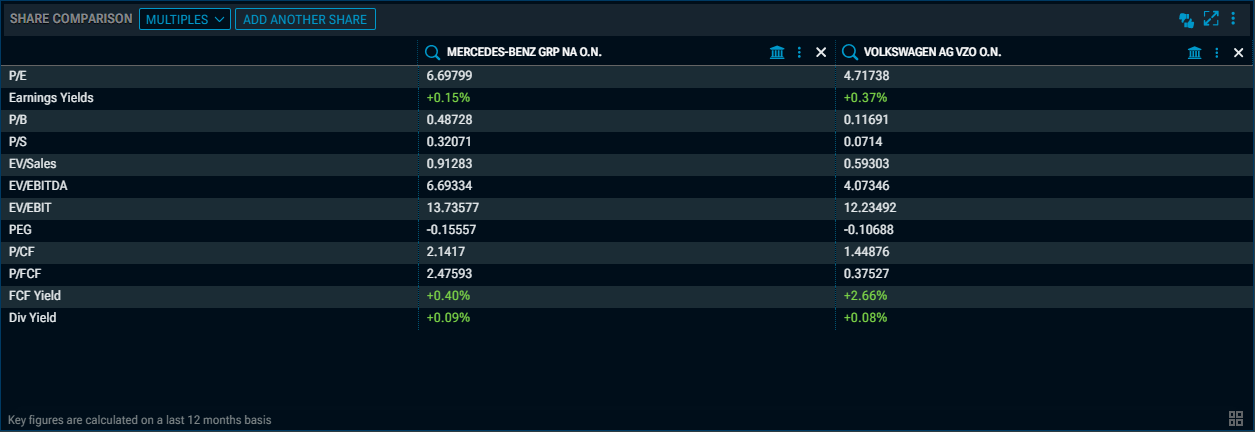
Share Comparison – "Multiples" view
Select the “Multiples” view from the drop-down list at the top to see the following key figures side by side:
Share Comparison – "Capital structure" view
Select the “Capital structure” view from the drop-down list at the top to see the following capital ratios side by side:
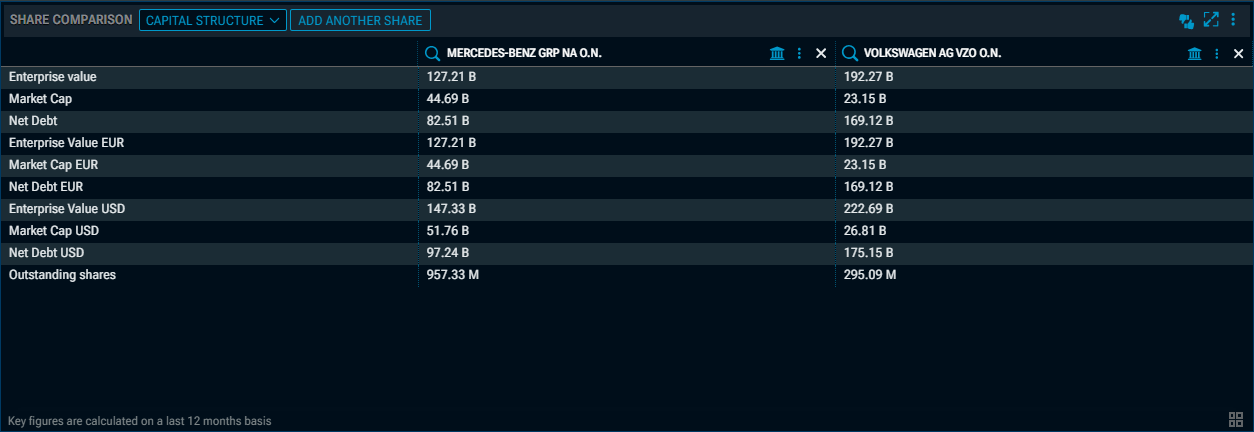
Key figures are calculated on a last 12 months basis.
Alerts: Signal alert for two Moving Averages (Improvement – IM-14954)
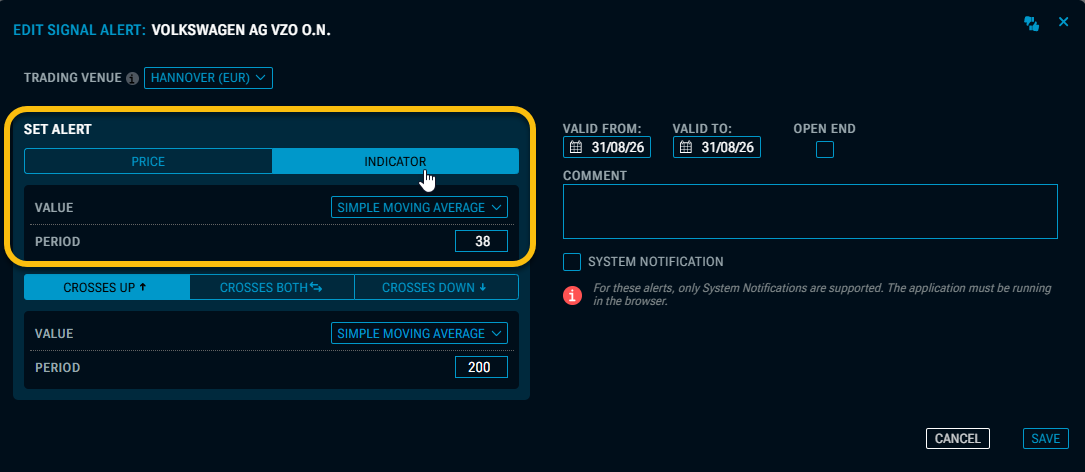
Indicator alerts can now also be configured for the intersection of two moving averages. To do this, in the “Edit Signal Alert” dialogue box, in the “Set Alert” section, select “Indicator” instead of “Price” for the first line, then choose the desired moving average (exponential or simple) and the number of days.
Exchange Calendar: Select Index, Portfolio or Watchlist (Improvement – IM-14797)
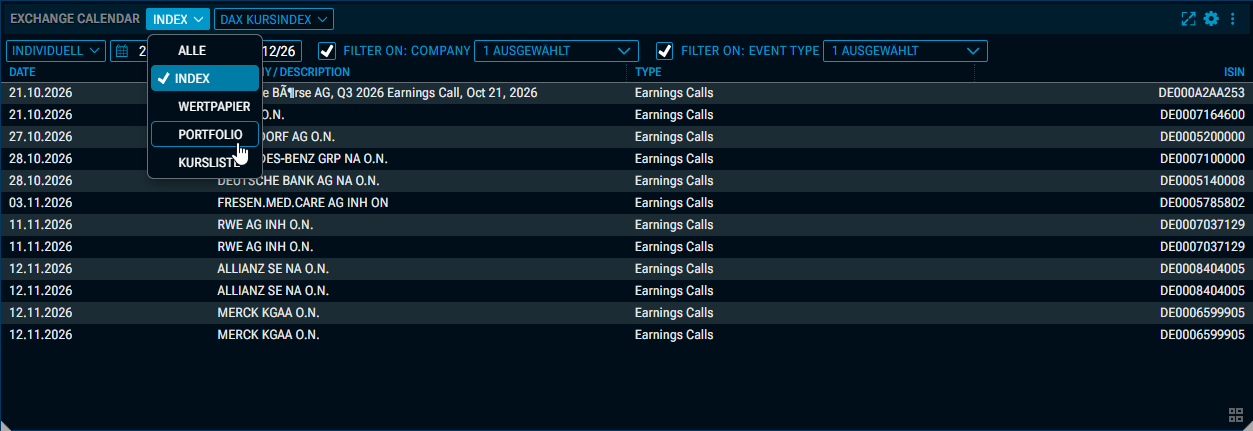
Until now, in the “Exchange Calendar” widget, you could either list all available events within a given period or select a security from the drop-down list at the top to filter the calendar for relevant events.
You can now also select a portfolio, a watchlist or an index (and its constituent securities) as the basis. The events will then be listed accordingly for the securities included.
Portfolio, Watchlist: New view "Heatmap" (Improvement – IM-15162, IM-15213)
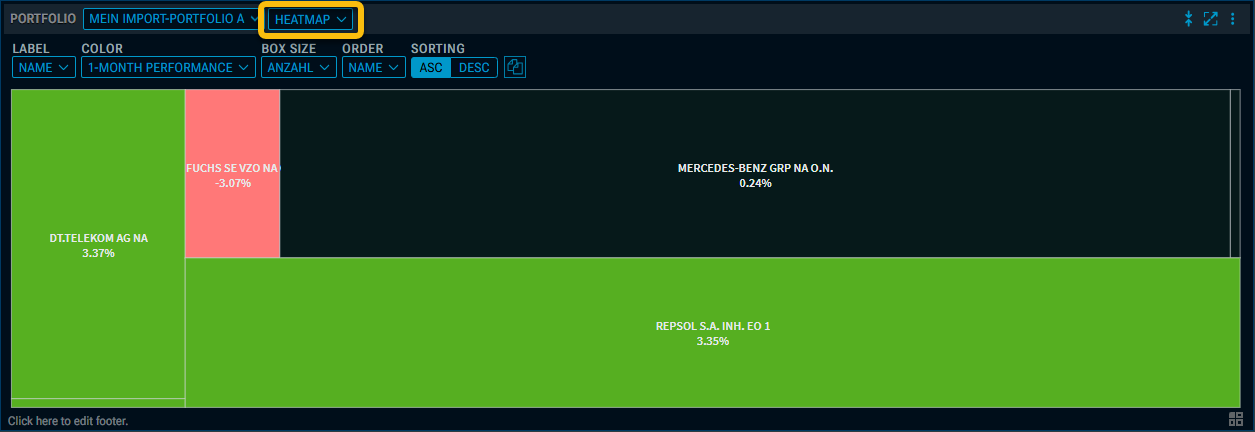
The popular “Heatmap” view is now also available for portfolios and watchlists via the view drop-down menu in the header of the widgets.
Example "Portfolio"
Example "Watchlist"
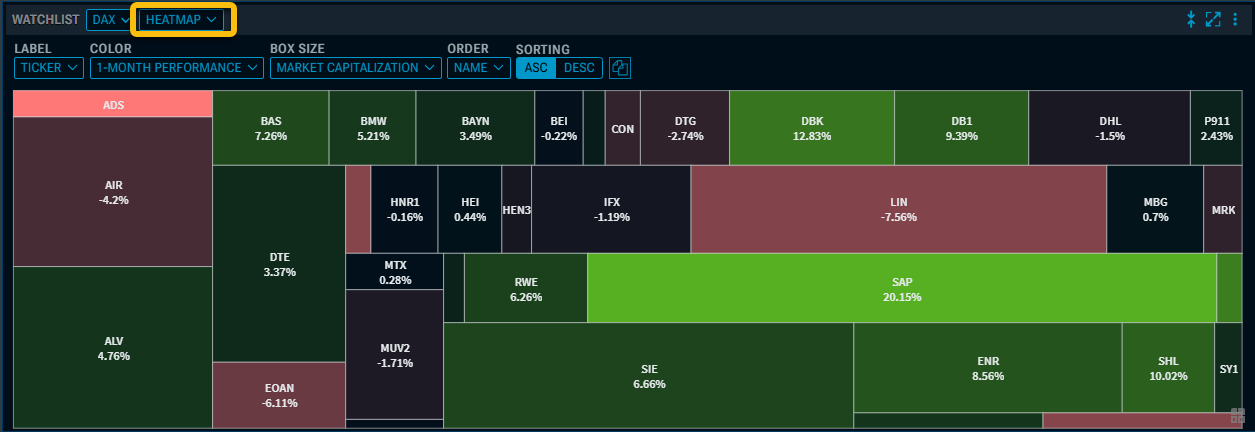
The configuration options above the heatmaps offer a wide range of settings:
|
Element |
Description |
|
Label |
Use this drop-down list to select which label should be displayed in the tiles. You can choose from the following fields:
|
|
Colour |
Use this drop-down list to select the criterion that determines the colour of the tiles. You can choose from the following criteria:
|
|
Box size |
Use this drop-down list to select which field should determine the size of the tiles. You can choose from the following options:
|
|
Order |
Use this drop-down list to specify the display order. You can choose from the following criteria:
|
|
Sorting |
Use the “ASC” and “DESC” buttons to select the sort order. |

Copy chart to clipboard |
Select this icon to copy the heatmap to the clipboard. |
You can also use the EXPORT command in the widget menu to export the heatmap as a JPEG, PNG, SVG or PDF.
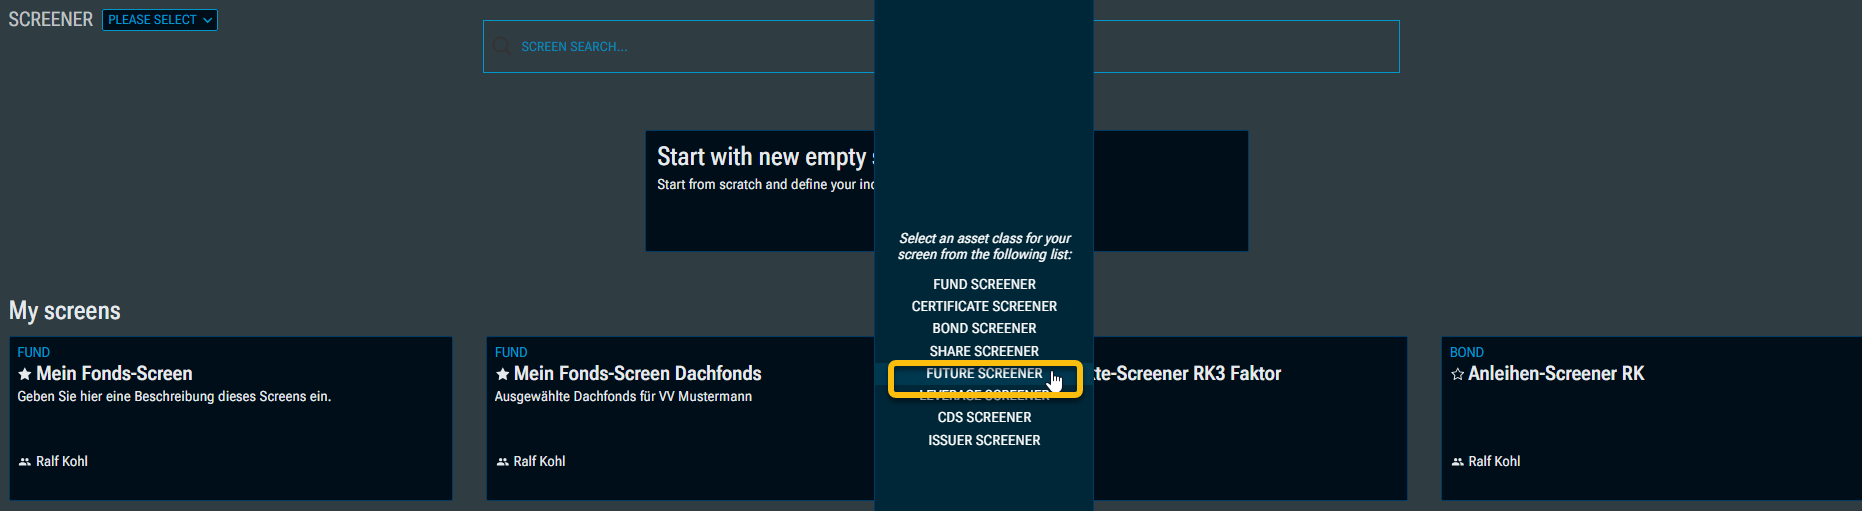
Screener: Future Screener (New – IM-14275)
A Future Screener is now also available in the screener tool. Use this screener, which has been optimised for this type of security, in your futures analysis.
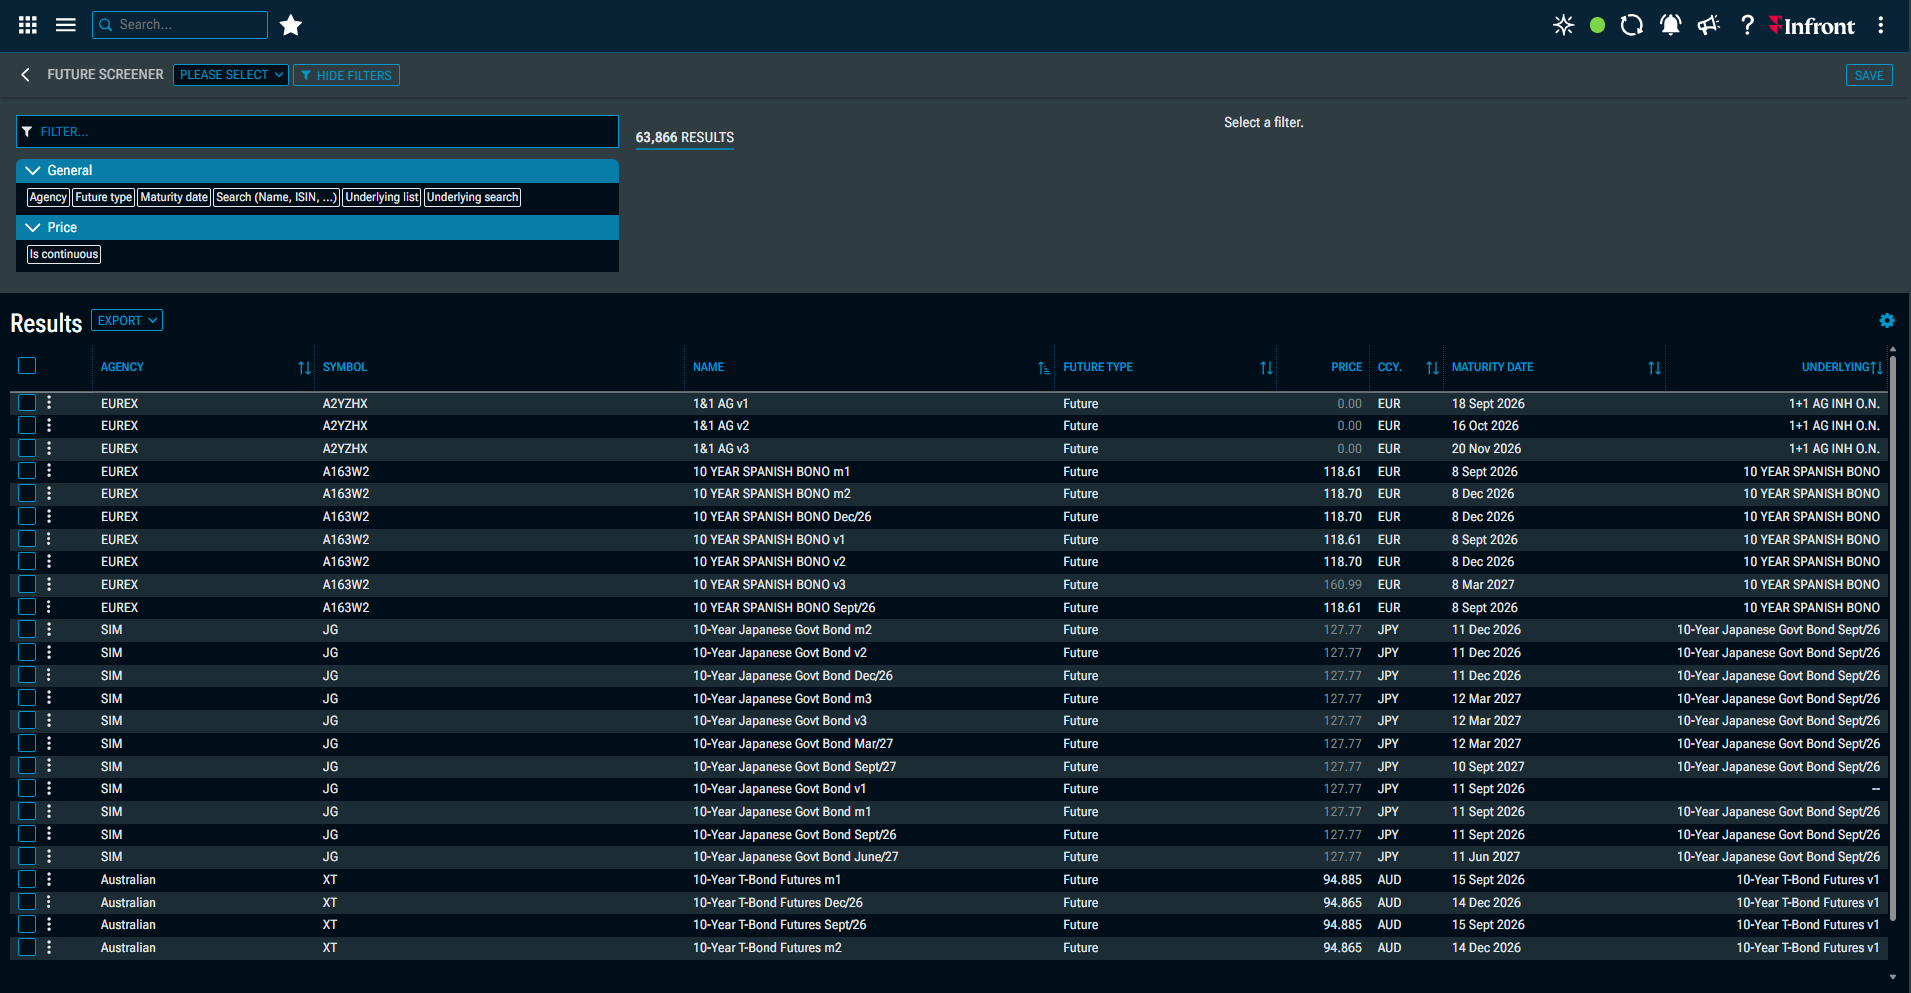
Filter in futures screens
Specifically, the following filters are currently available for your futures screens:
Filter "General":
-
Agency
-
Future type
-
Maturity date
-
Search (Name, ISIN, …)
-
Underlying list
-
Underlying search
Filter "Price":
-
Is continuous