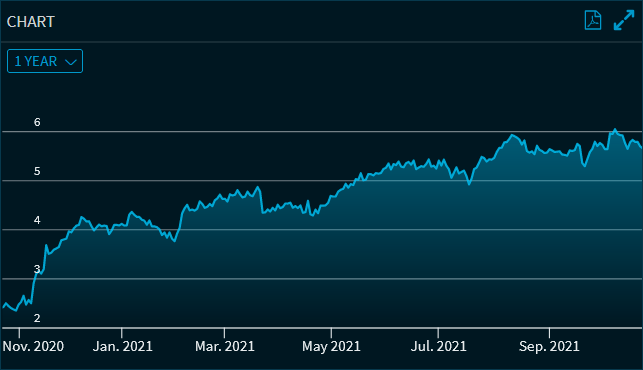
In the "Chart" widget, you can see the price performance of the currently selected certificate as a chart diagram.
You can choose between the following time intervals using the selection list at the top left of the widget:
-
1 year
-
3 years
-
5 years (default setting)
-
10 years
-
Max (all available prices)
![]()
You can enlarge the chart widget to the maximum window size by clicking on the icon at the top right of the widget. Clicking on the icon again restores the original display.
![]()