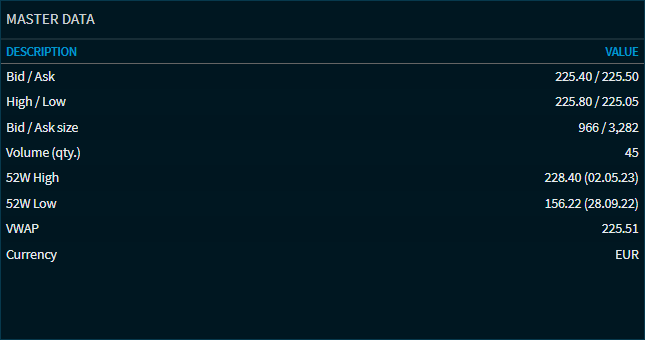
You will find the following values for shares in the "Master data" Compass widget:
|
Field |
Description |
|---|---|
|
Bid/Ask |
The current bid and ask prices of the security. |
|
High/Low |
Daily high and low of the security. |
|
Volume Bid/ask (Bid/Ask quantity) |
The quantity for the last bid and ask price. |
|
Volume (qty.)
|
The previous daily turnover. |
|
52W High |
The highest price of the security in the last 52 weeks. The corresponding price date is shown in brackets. |
|
52W Low
|
The lowest price of the security in the last 52 weeks. The corresponding price date is shown in brackets. |
|
VWAP |
The VWAP (Volume Weighted Average Price) of the security. |
|
Currency |
The security currency. |