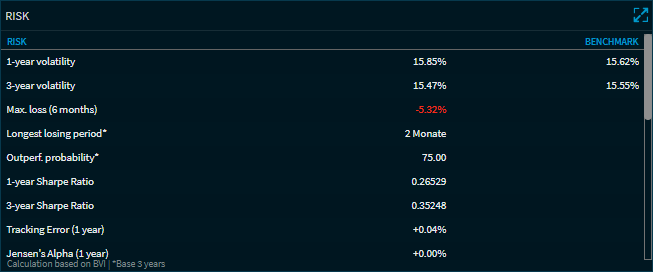
In the "Risk" Compass widget, you will find the most important risk figures for ETFs and funds as well as a risk-performance chart of the fund and its benchmark.
The key figures for the fund and the associated benchmark in detail:
-
1-year volatility
-
3-year volatility
-
Max. loss (6 months)
-
Longest loss period (basis 3 years)
-
Outperf. probability (basis 3 years)
-
1-year Sharpe ratio
-
3-year Sharpe ratio
-
Tracking error (1 year)
-
Jensen’s alpha (1 year)
-
Beta factor (1 year)
-
Positive regression (basis 3 years)
-
Negative regression (basis 3 years)
-
Diamond rating
-
SCOPE fund rating
-
SRI ("Socially Responsible Investment")
Risk performance chart compared to the fund benchmark
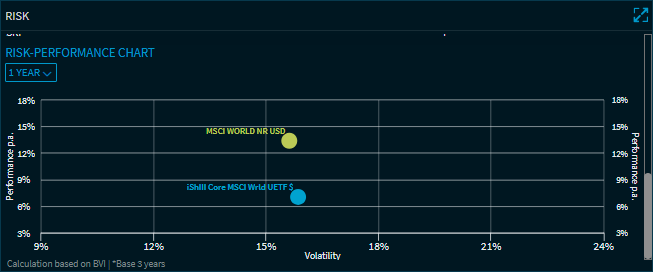
You can use the drop-down list to choose between the following time periods for the chart:
-
1 year
-
3 years
-
5 years
Point to the dots in the chart to display the corresponding values.