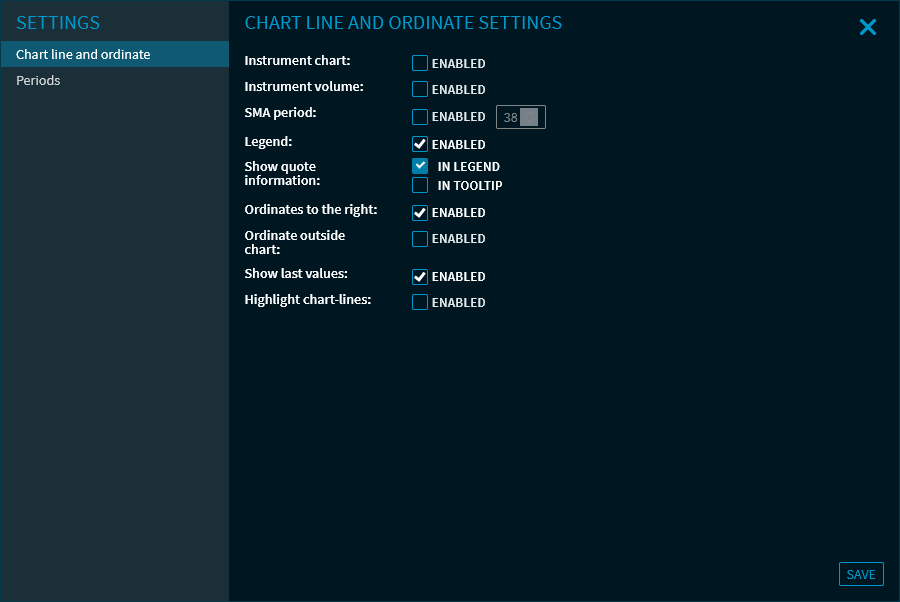
Settings in the "Volatility Chart" widget
![]()
Alternatively, you can use the "Settings" command in the widget menu.
Configure your volatility chart. You can find the following settings:
Settings for chart line and ordinate settings
Field | Description |
|---|---|
Instrument chart | Select this checkbox to draw the selected security next to the volatility chart line. If the securities chart is displayed, then you can select a type from the chart types.
|
Instrument volume | Select the "enabled" checkbox to display the volumes of the security in the chart. The volumes are shown as a histogram at the bottom of the chart after you save the settings. |
MA period | Select the "enabled" checkbox to show the moving average (MA) in the chart. Use the input field to enter the analysis period for the MA. The default setting is "38". When you save the settings, the MA is shown as an additional time series in the chart. |
| Legend | Clear this checkbox to hide the legend shown by default on the upper left side of the the volatility chart. |
| Show prices | By default, the price is displayed when pointing to the chart lines to the right of the respective legend entries. Select the "In tooltip" checkbox to display the prices directly at the mouse pointer as tooltip. |
| Ordinates to the right | By default, the ordinates are displayed on the right. Clear this checkbox to display the y-axis values on the left side. |
| Ordinate outside chart | By default, the ordinates are displayed in the chart window. Select this checkbox to display the y-axis values outside of the chart. |
| Show last values | Clear this checkbox to turn off the default display of current prices on the right side of the chart. |
| Highlight chart line | Select this checkbox to switch on the "highlighting" of the chart lines (when pointing to the lines in the chart or in the legend). This setting is disabled by default. |
"Save" button | Closes the "Settings" dialogue window and saves the changes. |
Example: Volatility chart with displayed security time series, volumes and MA 65

For more information about the widget settings, see Commands in the widget menu.
"Periods" settings
The settings for individual time periods correspond to those for "normal" charts. For more information, see Settings in the "Chart" widget.