Settings in the "Chart" widget
![]()
Alternatively, you can use the "Settings" command in the widget menu.

Configure your chart. The various setting options are clearly grouped into several areas, which you can select on the left side:
- General
- Chart line and ordinate
- Advanced
- Period
General settings
Field | Description |
|---|---|
Push | To turn off the push data feed, clear this checkbox. |
| Show grid | Enable the desired settings for vertical and horizontal lines here. By default, only the horizontal grid lines are displayed in the chart. |
| Legend | Clear this checkbox to hide the legend shown by default on the upper left side of the chart. |
| Show prices | Select the setting for the price display in the chart here. By default, the price is displayed when pointing to the chart lines to the right of the respective legend entries. Select the "In tooltip" checkbox to display the prices directly at the mouse pointer as tooltip. |
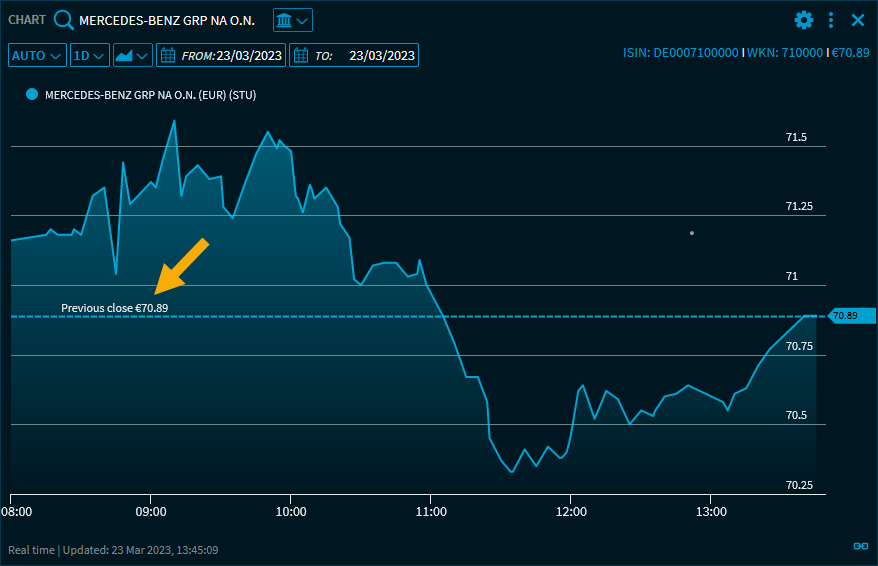
| Last closing price | If this checkbox is selected, then the closing price of the previous day is displayed as a horizontal line in intraday charts: Chart with displayed previous day's close
|
| Show last values | Clear this checkbox to turn off the default display of current prices on the right side of the chart. |
Settings for chart line and ordinate settings
Field | Description |
|---|---|
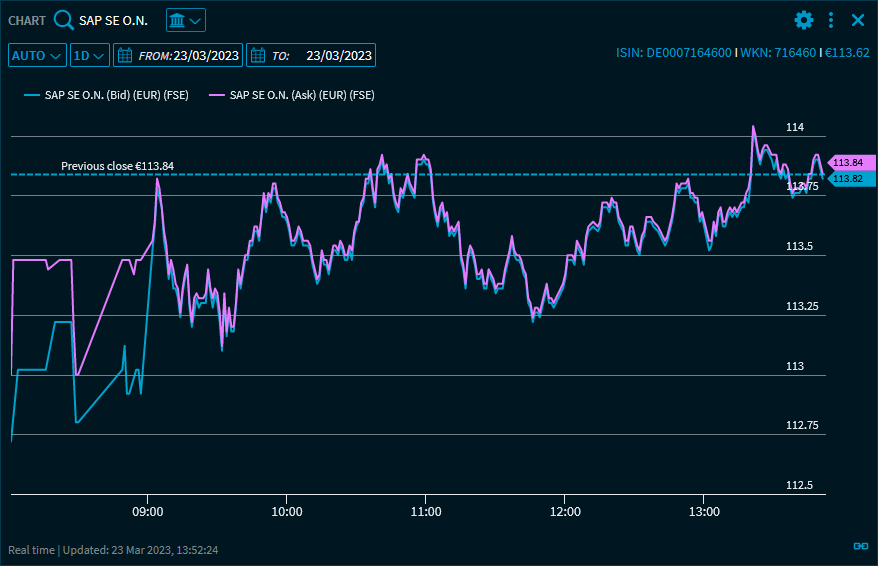
| Intraday price type | Select the price type here. The following options are available:
The default "Automatic" setting tries to use the optimal setting. For many securities, this is the last price. However, for a derivative with its issuer trading venue is selected only bid and ask prices are available in the short-term range ("1 hour" to "1 week"). The intraday charts are also automatically calculated from these value. When you switch to larger periods, an automatic adjustment takes place. Chart with the "Bid/Ask" intraday price type
|
| Include corporate actions | By default, corporate actions are taken into account in the chart display for the selected instrument. To change this setting, clear this checkbox. Correction factors largely play a role in insuring the comparability of prices. If this option is disabled, meaningful comparisons become considerably more difficult. |
| Include dividends (alters hist. quotes) | By default, dividends are taken into account in the chart. To change this setting, clear this checkbox. Please note that this alters the historical prices. For funds, the label of this field changes to "Include distributions (changes hist. prices)". If the "BVI performance" setting is enabled, then the value "enabled (BVI performance)" is automatically set for this field. |
| BVI performance | Select this checkbox to consider the security BVI performance. In this case, the settings of the fields "Ordinate" ("relative (BVI performance)") and "Include dividends" ("enabled (BVI performance)") are automatically adjusted. |
| Ordinate - type | Use this drop-down list to specify how to display the values of the ordinate. By default,
If the "BVI performance" setting is active, then the value "relative (BVI performance)" is automatically set for this "Ordinate" field. |
| Ordinate - position | By default, the ordinates are displayed on the right. Clear this checkbox to display the y-axis values on the left side. |
| Ordinate - chart canvas | By default, the ordinates are displayed in the chart window. Select this checkbox to display the y-axis values outside of the chart. |
| Highlight chart line | Select this checkbox to switch on the "highlighting" of the chart lines (when pointing to the lines in the chart or in the legend). This setting is disabled by default. |
Advanced settings
Field | Description |
|---|---|
MA period | Select the "enabled" checkbox to show the moving average (MA) in the chart. Use the input field to enter the analysis period for the MA. When you save the settings, the MA is shown as an additional time series in the chart. The default setting for the first MA is 38 days. |
| MA period 2 | Select the "enabled" checkbox to show another moving average (MA) in the chart. Use the input field to enter the analysis period for the MA. When you save the settings, the MA is shown as an additional time series in the chart. The default setting for the second MA is 200 days. |
| Show underlying | By default, the available underlying values of derivatives are displayed in the chart. Clear this checkbox to hide these. |
Volume | Select the "enabled" checkbox to show the volumes in the chart. The volumes are shown as a histogram at the bottom of the chart after you save the settings. |
| Benchmark | Select a benchmark for the security selected. Open the drop-down list and search for the corresponding reference security. When you save the settings, the benchmark is shown as an additional time series in the chart. It is then automatically switched to the percentage display (base 100%).
You can also drag a security to the "Chart" widget to show it as a benchmark. If there was already a benchmark in the target widget, then it is replaced by the new benchmark. See also Drag security to chart.
Click the "Remove" button visible after selecting a comparison value to remove a selected benchmark. |
"Periods" settings
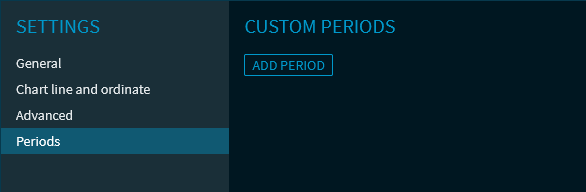
In this section of the settings, you can define individual, custom display periods for your charts. To do this, follow these steps:
- On the left side of the "Settings" dialogue window, select the "Periods" area.
- Click the "Add period" button.
- Enter the relevant name for the first custom period in the "Name" input field.
- Then click the "Settings" button for this period.
- Configure the new time period. The table below contains descriptions of the individual setting options.
- Then click the "Save" button. (Use the "Back" button to exit the settings for the period without saving any changes you may have made).
- If you want to add further columns, then select the "Add period" button in the "Periods" area and proceed in the same way.
You can delete your own time periods by clicking the respective "Delete" buttons.
The settings of the custom time periods in detail:
| General | |
|---|---|
| Field | Description |
| Name | Enter the relevant name for the period here. You can freely define the name of a period - or leave it blank for the time being and use the automatic name generation. The name of the column is then automatically generated by the system according to the time periods you set. The name of the period can be changed later. |
| Automatic naming | Select this setting to automatically generate the name of the period. The name is generate depending on the time periods and start and end times set below. |
| Selected period | Here, you can see the always updated period resulting from your settings. This data is not editable here. To set the calculation period, it is recommended to first define the methodology for the end date (Absolute date, Now, Relative to...). Then do the same for the start date. In the "Selected time period" row, you will then see the start and end date that results from the respective parameter selection. |
| Select start date | |
| Field | Description |
| Date from | Here, you can set a fixed starting date. To do this, select this check box and then enter the corresponding start date using the calendar integrated into the input field. The default setting is 1 month into the past. |
| Relative | Here, you can set a relative starting date. To do this, select this checkbox and then select the relevant starting time from the drop-down list. The following entries are available:
|
| Period starting from the end date | Here, you have the option to define a calculation period starting from the end date. To do this, select this checkbox and then first select the relevant period from the drop-down list and then enter the relevant number in the input field. The following periods are available:
The default setting is 1 months. |
| Select end time | |
| Field | Description |
| Date to | Here, you can set a fixed end date. To do this, select this check box and then enter the corresponding end date using the calendar integrated into the input field. The current date is set by default. |
| Now | Here, you have the option of setting the current date as the end date (default setting). Select this checkbox. |
| Relative period starting from the end date | Here, you can set the date to the desired end time relative to a date in the past. To do this, select this checkbox and first select an end date from the upper list. The following entries are available:
You can then select the period and enter the corresponding number in the input field. The following periods are available:
Example In August 2021, the setting "End of previous quarter" and "2 months" result in the end date "April 30, 2021". |
The defined and saved time periods are then available for selection in the widget in the drop-down list of time periods. The user-defined periods are added at the bottom of the drop-down list.

Operating elements
Element | Description |
|---|---|
"Save" button | Closes the "Settings" dialogue window and saves the changes. |
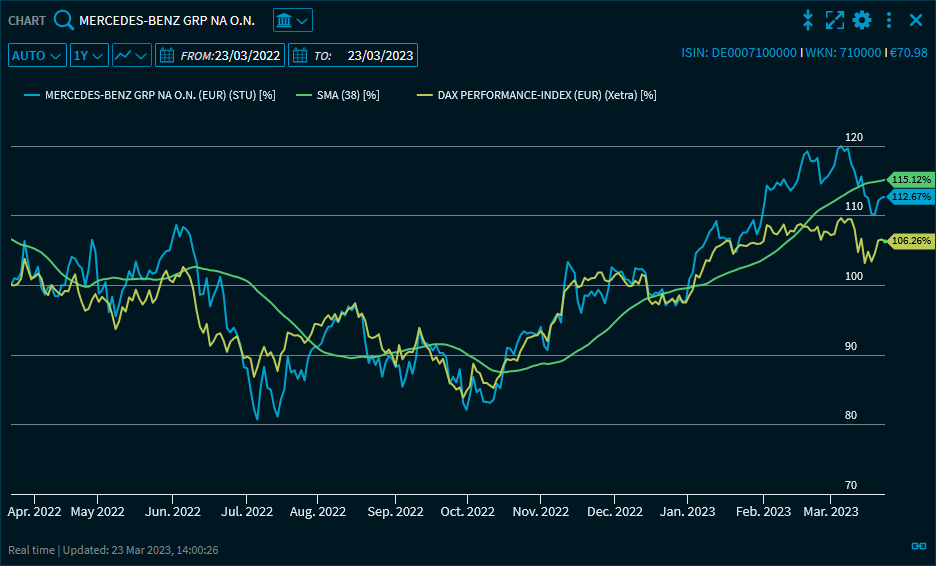
Example: Mountain chart with displayed volumes, benchmark "DAX" and MA38:
For more information about the widget settings, see Commands in the widget menu.