Volatility Chart
With the "Volatility Chart" widget, you can visualise the historical volatility.
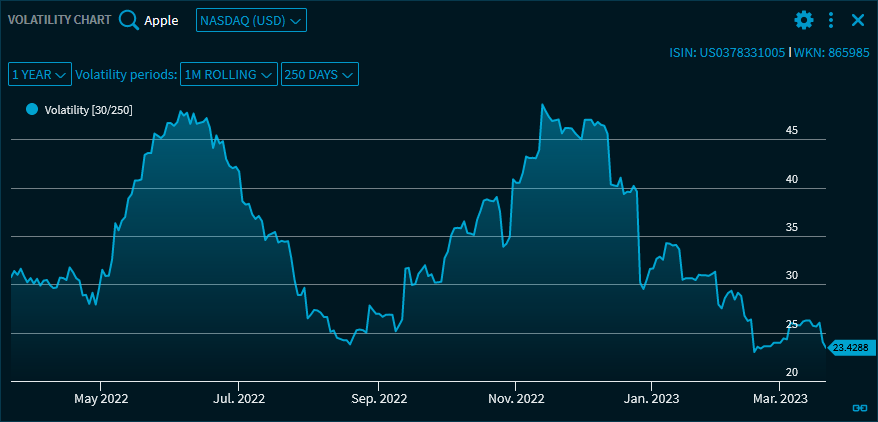
Use the drop-down list in the upper part of the "Volatility Chart" widget to select from the following settings:
Element | Description |
|---|---|
"Instrument search" icon | Use the integrated quick search to search for the security to be displayed. After selecting a security, the name is displayed at the top left of the widget. |
Select trading venue | You find the trading venue drop-down list next to the security drop-down list. Select the trading venue. |
"Period" drop-down list | Below you will find the period selection. Select from the following periods:
|
Volatility periods | Select the calculation periods. The following choices are available:
In addition, you can exactly specify the number of trading days per year in the calculation:
The specified periods are then shown in the drop-down list and in the legend (in brackets). |
Icon “Copy chart to clipboard" | Click this Icon to copy the chart to the clipboard. |
By using the widget's menu icon, you can export the charts in the "Volatility Chart" widget to various file formats.
For more information about charts, see Chart.
In the Widget Gallery, you can find the "Volatility Chart" widget in the "Other" section of various security types, in the "Default columns" area for shares.