Triple Exponential Average
Type
Trend indicator
Short introduction
The Trix was developed by Jack K. Hutson and corresponds to a Rate of Change (ROC ) of a triple smoothed Exponential Moving Average.
Statement
The triple smoothing really eliminates all non-significant "price outliers" from the chart's course. First an exponential MA is formed by an exponential MA by an exponential MA, thus a triple exponential MA. Normally, a one-day ROC is calculated for this course.
Formula/calculation
Tt = EMAt (EMAt (EMAt (log(Close))))
where the first EMA applies:
EMA1t = a x log(Closet) + (1-a) x EMAt-1
The TRIX itself is the percentage rate of change of the 3-fold exponentially smoothed moving average (Tt):
TRIXt = 100 × ( Tt – Tt-1 ) ÷ Tt-1
Interpretation
The course of TRIX shows, just like a MA, the current trend in the underlying. Because the indicator reacts very slowly due to the multiple smoothing, it is not recommended to use the crossing of the zero line as a signal generator. It makes more sense to lay a MA over the actual TRIX again and to interpret the crossings as signals.
A buy signal is given when the TRIX indicator crosses its MA from bottom to top, a sell signal when the indicator crosses its MA from top to bottom.
Default setting
- There is no unique standard, but often quite short periods of max. 15 days are used for the MA of TRIX. In the literature, always a one-day ROC is used.
- For signal generation, a 5- or 9-day MA is often used.
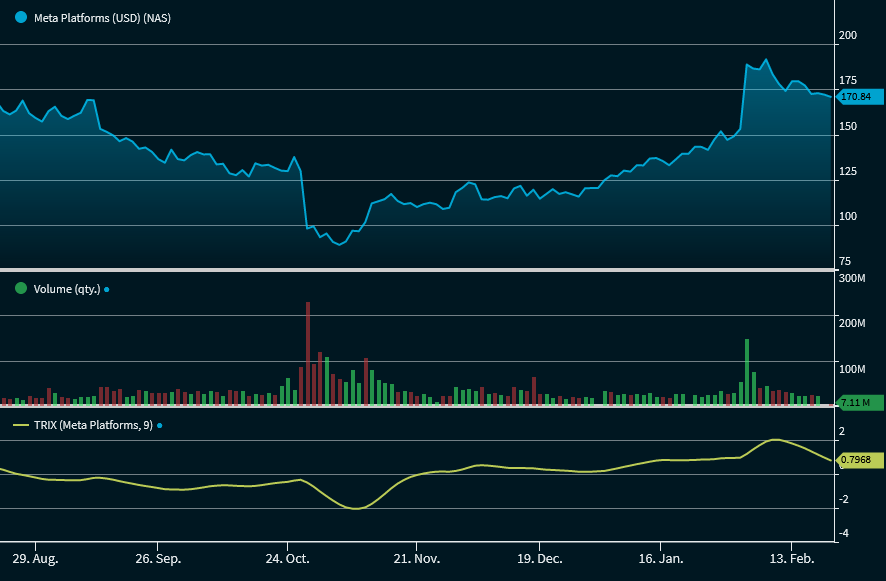
Example: TRIX