Strategy matrix
Below the option list, you find the strategy matrix. The separate matrix has its own filter and settings area.
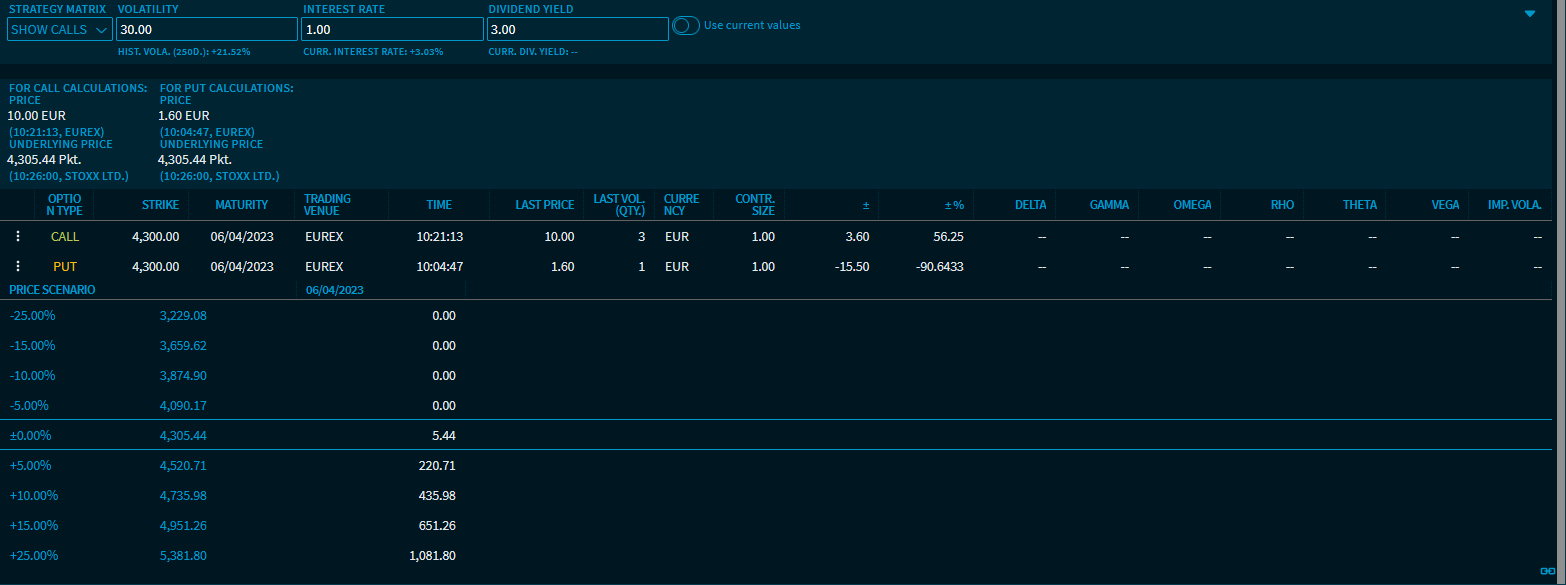
The strategy matrix determines the fair value for the various scenarios and maturities.
The individual price scenarios are determined for the strike price or maturity selected in the option list.
The following filter options are available in the filter area of the strategy matrix:
Filters | Description |
|---|---|
Display | First select if you want to analyse calls or puts. |
Volatility | Enter the required volatility in percent. The default setting is 30 days. Volatility is one of most important factors for determining the option price. We distinguish between the historical volatility and the assumed volatility for the future (implied volatility): The historical volatility measures the dispersion of returns (standard deviation) of an underlying over a given period in the past, for example, 250 days. The value is shown in percent per annum. The historical volatility is only partially useful to determine option prices because the future volatility of the underlying is key. It can only be estimated by market participants, the historical volatility is used for the estimation. A higher estimated volatility results in a higher option price. From each option price (bid or ask) and from each trading price, you can determine the volatility used to calculate the option price. This volatility included in the option price is referred to as implied volatility. |
Interest rate | Enter the current interest rate for the calculation. As interest rate, select the short-term interest rate of the corresponding country relevant for the time to maturity. In practice, the so-called repo rate is used in the calculation. |
Dividend yield | Enter the dividend yield to be used in the calculation. |
Use current values | Turn this switch on to use the current values for the volatility, interest rate and dividend yield as shown in the table below. |
In the strategy matrix, the key figures are calculated for call and put and various price scenarios are shown for the settings specified.
Here, you see more details about the options currently selected above. (The corresponding row is highlighted in the option list.)
By using the widget settings, you can show or hide the prices of the underlying, call and put used in the calculation in the strategy matrix:
You can find the following information about the maturity and strike price of calls and puts:
- Option type (call or put)
- Strike price
- Maturity date
- Trading venue
- Last price
- Last volume (qty.)
- Currency
- Contract volume
- Absolute change to previous day ("+/-")
- Relative change to previous day ("+/- %")
- Time of the last update
- Option key figures delta, gamma, omega, rho, theta and vega
- Implied volatility
For more information about indicators, see the Börsenlexikon.
The prices are calculated for the following possible changes in the underlying price:
- -25%
- -15%
- -10%
- -5%
- Unchanged
- +5%
- +10%
- +15%
- +25%
Use the "Display" drop-down list to switch between calls and puts. "Show calls" is set by default.