Relative Strength Index
Type
Momentum oscillator
Short introduction
The relative strength index developed by Welles Wilder is, together with the MA and momentum, one of the most frequently used indicators. The common abbreviation is "RSI". The Wilder RSI is not to be confused with the relative strength of a security in relation to another security or index. The RSI can assume values in the range from 0 to 100 percent.
Statement
The RSI tries to measure the inner strength as the development of the security within a certain number of days. In the RSI, a ratio is formed between the upward and downward movements of the respective daily prices. The indicator itself always fluctuates between 0 and 100. The advantage of this normalisation lies in the better comparability of individual values. By including all prices within the period, Wilder also achieves a certain smoothness, extreme prices do not distort the calculation as much.
Formula/calculation
The calculation of the RSI is done in several steps:
Within the observation period, the differences of the closing prices trading upwards (today's close > yesterday's close) and the downside closing prices (today's close > yesterday's close) are summed up and then divided by the number of observations minus one (n days can only result in n-1 changes). The result is the average daily value for the upward and downward force of the underlying security.
"Relative strength" (RS) is calculated by dividing the average upward force by the average downward force. The RSI is obtained by subtracting from 100 the quotient of 100 divided by the sum of one plus "relative strength".
If Ct > Ct-1, then u = Ct - Ct-1 and d = 0.
if Ct < Ct-1, then d = Ct-1 - Ct and u = 0.
U = ((n - 1) × Ut-1 + u) ÷ n
(U = Average of upside closing price movements over the last n days)
D = ((n - 1) × Dt-1 + d) ÷ n
(D = Average of downward closing price movements over the last n days)
RS = U ÷ D
RSI = 100 - 100 ÷ (1 + RS)
Interpretation
If the RSI reaches its minimum value of 0 (zero), then the instrument has no inner strength. The prices have therefore only fallen during the observation period. A value of 100 means that prices have only increased. Values close to 0 (zero) indicate an oversold underlying, values close to 100 indicate an overbought market. At such points, a counter-reaction is to be expected. However, the real signal is only generated when the indicator leaves the extreme range around the minimum or maximum again.
The RSI can also be studied on technical chart formations because the RSI forms these more often than the underlying. The interpretation is similar to that of the patterns in the underlying.
Default setting
- n = 14 days
- Overbought: over 70%
- Oversold: less than 30%
By using the parameters of the RSI, you can also change the display from relative (default) to absolute. To do this, clear the "Percentage" checkbox. The default settings are then:
- n = 14 days
- Overbought: over 0.7
- Oversold: under 0.3
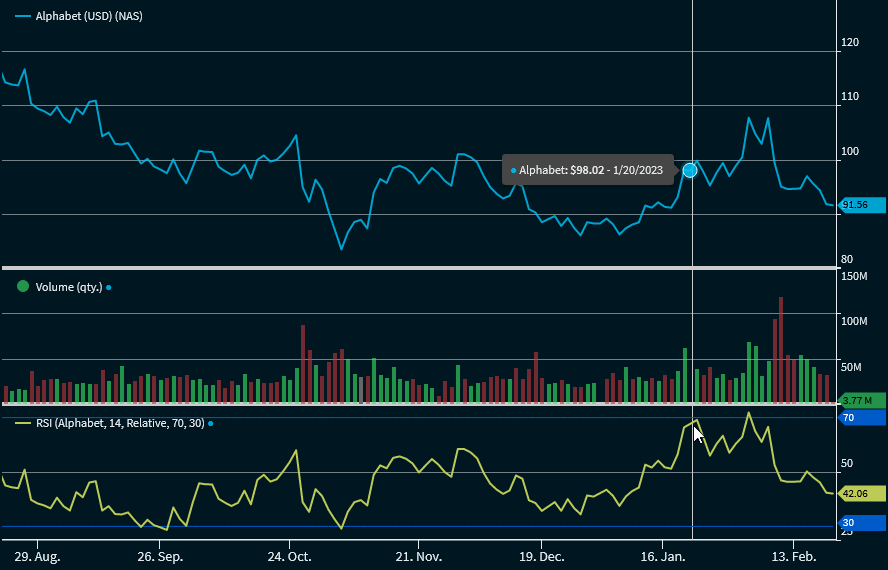
Example: Chart with RSI in default setting