Point and figure chart
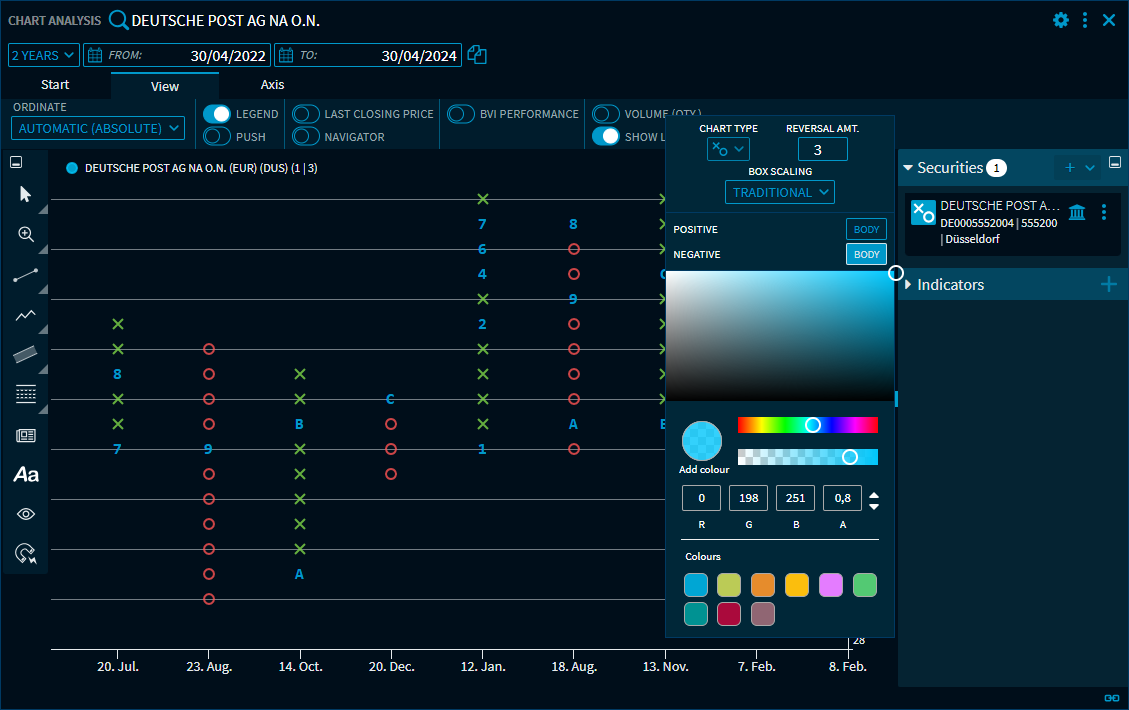
The "Point & figure" chart type is only available in the "Chart Analysis" widget.
![]()
The point & figure chart is a combination of X and O columns, the so-called boxes. The X indicates increasing prices (upwards trend), the O falling prices (downwards trend).

Special configuration options for this chart type are available in the settings menu:
| Element | Description |
|---|---|
| Box size | Enter the corresponding box size. The default setting for the box size is "1". The box size defines the rate range for a box, that is, a price must change by this value for a new box to be plotted. Minor changes are "ignored". Example: Box size 5: The price must rise (fall) 5 points above (or below) the price of the last box for the next "X" (or "O") to appear. |
| Box scaling type | Select the required order Box scaling here. The following types are available:
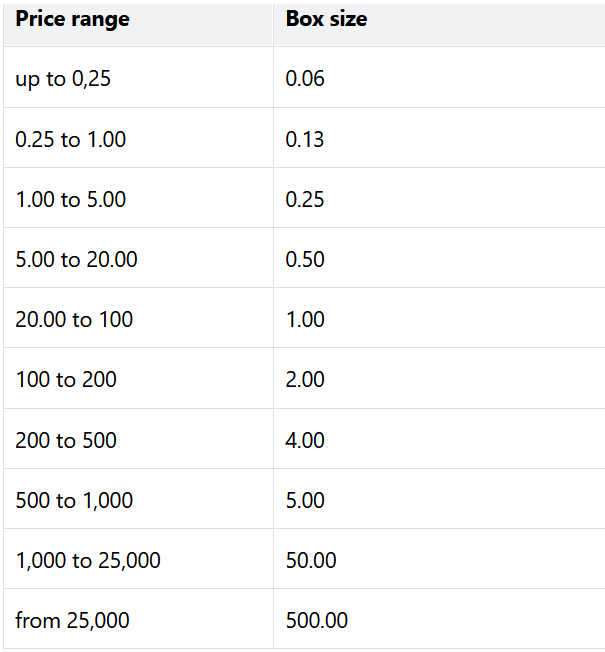
Details to the "Traditional" type
This method uses a predefined table with price ranges to define the box sizes.
Details to the "ATR" type
This box scaling type is based on the daily “Average True Range (ATR)”. The Average True Range (ATR) is a measure for the volatility of a security. A higher ATR value causes greater boxes. The dynamical scaling (ATR) estimates the Average True Range for a security in the period to define the box sizes. The default period for the ATR is 20 days. |
| Reversal amount | Enter the relevant reversal amount. The default setting is the reversal amount "3". This value defines how many boxes the security must produce in the reverse direction to produce a "reverse column". Example: Box size 5 and reversal amount 3: The price must run 3 boxes (or 15 points) against the current direction to create a reverse column. Box size and reversal amount are also shown in the legend for the point & figure charts. |
| Month view | This display is deactivated by default; when activated, the following month abbreviations are displayed for the start of each month (instead of "X" or "O"): |

| Code | Month |
|---|---|
1 | January |
2 | February |
3 | March |
4 | April |
5 | May |
6 | June |
7 | July |
8 | August |
9 | September |
A | October |
B | November |
C | December |
Advantages of this chart type
- Small price movements are not shown in the chart and thus facilitate the analysis
- Patterns can be recognised more easily because time is not displayed visually
- Drawing support and resistance lines is relatively simple
- Trend lines are easy to recognise
![]()