Performance Tile
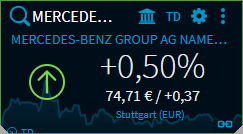
With the "Performance Tile" widget, you can place compact widgets for your favourite securities on your dashboard. You see the name of the security, the trading venue, the current price as well as the relative and absolute performance of the security. The arrow illustrates the current price development. Point to the price information to show the corresponding price time. You can use the Settings at the bottom of the "Performance Tile" widget to permanently display the price date or the current price time and configure an individual period for the performance calculation.
The shown data is optimised for the available space (one, two or three columns). The chart is shown in the background of the widget.
If you point into the widget, the upper elements are displayed. In the upper left corner, you can search and select a (different) instrument. In addition to the widget menu icon, the icons in the upper right corner of the widget provide the following functions:
Field | Description |
|---|---|
| Select a different trading venue from the icon drop-down list. |
| Select a different analysis period for the security from the icon drop-down list. The visible icon indicates the period currently selected:
If you have defined individual time periods via the widget settings, these will be added to the drop-down list at the bottom. |
| Clicking this icon opens the widget settings. If the widget is very small, this icon disappears. In these cases, however, the "Settings" command in the menu icon is available to you as an alternative at any time. |
In the Widget Gallery, you find the "Performance Tile" widget in the "Standard" section of the corresponding instrument types.