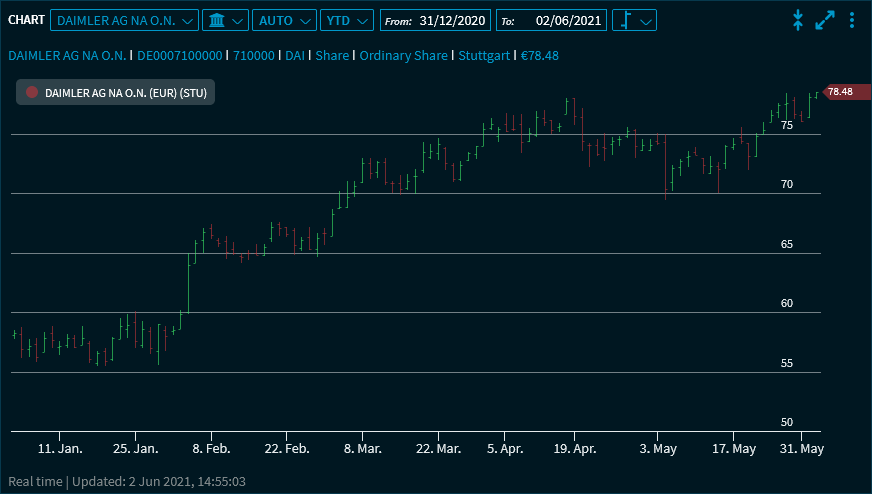
OHLC chart
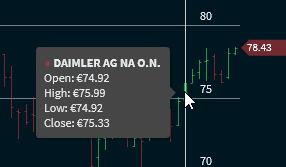
The vertical line's upper end represents the high, the lower end the low. The small horizontal dash to the left is the opening price, the small horizontal dash on the right is the closing price.
Point to the lines to show the corresponding values.