Index Members
In the "Index Members" widget, all index members of an (equity) index such as Dow Jones or Hang Seng are shown in a table or tile view.
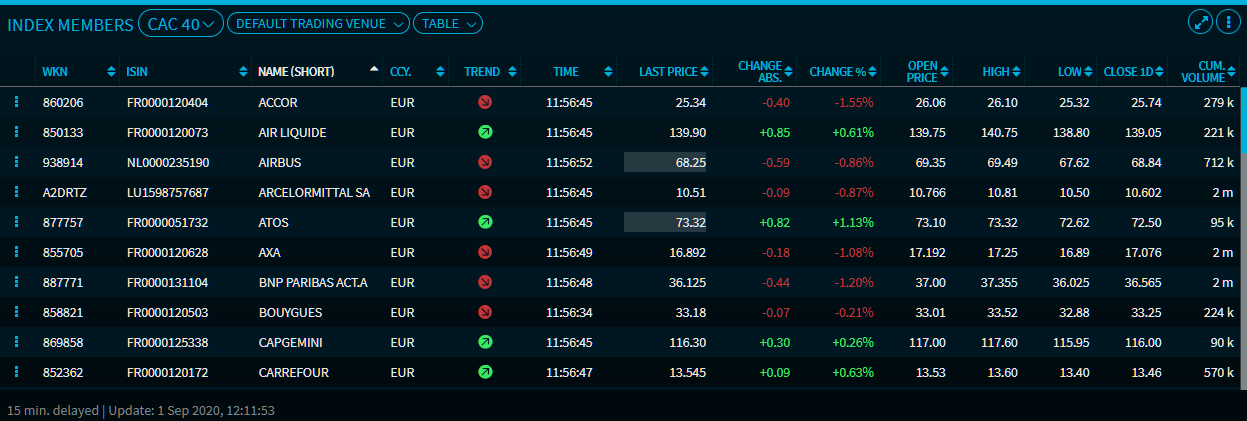
The upper area of the widget provides the standard functions as well as drop-down lists to select the instrument, trading venue and view. In the table view of the "Index Members" widget, you find the following columns:
- WKN
- ISIN
- Name (short) (the table is sorted by this column by default)
- Currency
- Trend
- Time
- Price
- Absolute change
- Percentage change
- Open
- High
- Low
- Close
- Cum. volume (qty.)
- 52-week comparison (hidden by default)
In this column, you can see the current price compared to the 52-week low ("left edge of the bar") and 52-week high ("right edge of the bar"). A small example can be found in the arbitragesection. - All-time high (hidden by default)
- All-time low (hidden by default)
- Cum. trades
- Sector (hidden by default)
- A-Amount (hidden by default)
- Ask (hidden by default)
- Open time (hidden by default)
- B-Amount (hidden by default)
- Bid (hidden by default)
- Trading venue (hidden by default)
- Instrument ID (hidden by default)
- Name (hidden by default)
- Close price supplement (hidden by default)
- Close time (hidden by default)
- Ticker (hidden by default)
- Cum. turnover (hidden by default)
- Trend (hidden by default)
You can show or hide all columns by using the settings dialogue window of the widget.
In addition to these default columns, you can also add any other columns from the "All Fields" widget. For more information, see Add fields from the "All fields" widget to watchlist or portfolio.
Indices with up to 100 securities (such as the NASDAQ 100) are displayed on one page. For more comprehensive indices, the display is then divided into 50 securities per page. Therefore, if an index contains more instruments (such as S&P 500), you can navigate through the pages using the navigation elements below the list.
You can use the second drop-down list above to define a trading venue to display the selected index. By default, you will see the "preferred trading venue" that you have set in the individual settings. The "Trading venue" column is hidden by in table view default and can be displayed via the widget settings.
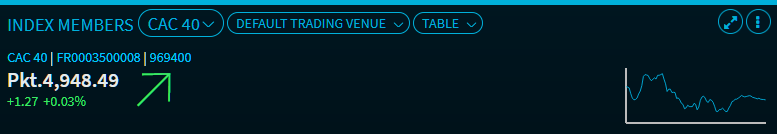
If the "Show index" option is enabled in the widget's settings, then you see details about the index displayed in the upper part of the widget:
Tile view
In the upper part of the widget, switch to the tile view by using the drop-down list.
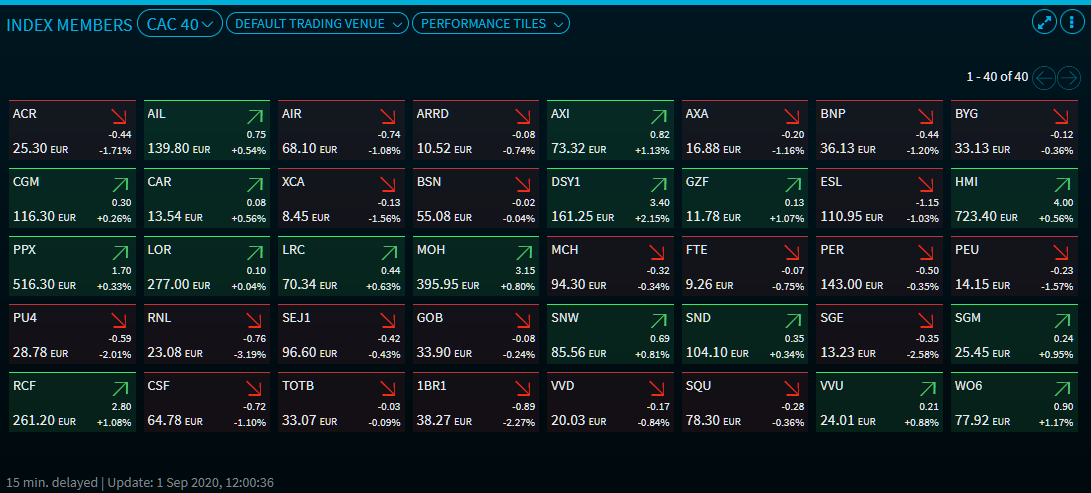
In the tile view, the colour of the tiles indicates the current price development of the securities. In the example, most of the DAX members are red, that is, they trend lower.
"Chart Gallery" view
Use the view drop-down list at the top of the widget to switch to the "Chart Gallery" view, in which the index members are displayed as individual charts in a Chart Gallery.
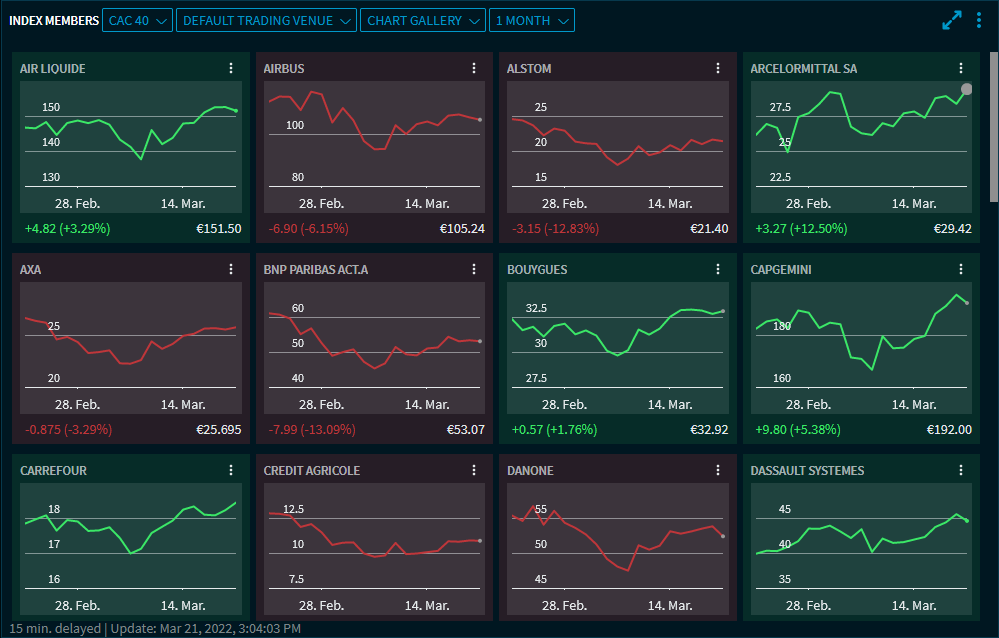
For details of this view, see "Chart Gallery" view in the Watchlist chapter.
In the Widget Gallery, you find the "Index Members" widget in the "Defaults" section of indices.
See also: