"Chart" area
Here, you see the visualisation of the simulation. Use the drop-down list to switch the view.
In the drop-down list, you find the charts for the following key figures:
- Profit/loss (P&L)
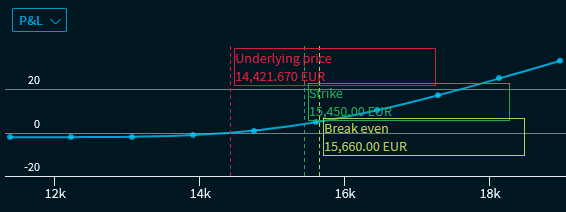
In this chart, you see the expected profits and losses as well as the changes of the fair value of the warrant (here, of the call) when the underlying price changes. The vertical line symbolises the strike price and the break even.
- Delta
- Gamma
- Vega
- Rho
- Theta
For more information about indicators, see the Stock exchange glossary.