Arbitrage
The "Arbitrage" widget shows the current prices of a share at all available trading venues in a table. This allows you to view all arbitrage possibilities at the most important global trading venues at a glance.

In the Widget Gallery, you find the "Arbitrage" widget in the "Default" section of the widgets for shares.
You can select any share with the security selection at the upper left.
By default, the arbitrage table has the following columns for the quotation of the security:
Column | Description |
|---|---|
Trading venue | The name of the trading venue. |
Ccy./Unit | The currency of the quote is usually displayed here. For percentage-quoted bonds, "%" is displayed instead. If you would like to display the "actual currency" for such securities as well, you can drag the currency field with ID 48 into the list by using the "All Fields" widget. |
Time | The time of the last price determination. |
Delay | The symbols in this column indicate whether the data is displayed in real time or is delayed.
Point to the symbols to view the delay in minutes. |
Price | The price of the last trade of this share on the corresponding trading venue. |
| Net change | The absolute change of the current price from the "Paid" column compared to the previous day's close. |
% | The change in percent of the current price from the "Paid" column compared to the previous day's close. |
B-Amount | The current total bid quantity for this security. |
Bid | The current bid price. |
Ask | The current ask price. |
A-Amount | The current total ask quantity for this security. |
Cum. turnover | The total daily turnover of the security on the trading venue selected. |
You can show or hide further columns by using the “Column configurator" area in the Settings:
Column | Description |
|---|---|
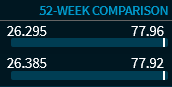
| 52-week comparison | The comparison of the current price in relation to the high and low of the last 52 weeks.
The vertical bar in the chart symbolises the current price at that place; in the example, it is close to the 52-week high at both places. |
Number of trades | The number of trades on the current day. |
ID | The ID of the instrument with the code for the corresponding trading venue, for example "555750.ETR" for the quotation of Deutsche Telekom on the XETRA trading venue or "710000.FFM" for Daimler on the Frankfurter stock exchange. |
Name | The name of the security on the corresponding trading venue. |
Daily low | The day's lowest price. |
Daily high | The day's highest price. |
Trend | The symbols in this column indicate the performance trend of the last 8 ticks. |
Cum. volume (qty.) | The total volume of the quantity of the instrument traded. |
Last volume (qty.) | The number of the last trade. |
The arbitrage table is sorted by the "Cum. turnover" column by default. To sort by a different column, click the corresponding column header. To reverse the sorting, click the column header again.
In the widget's settings, you can specify the time interval at which the sort order should be updated.
See also: