"Top Flop" view (portfolio)
You can also view the securities of a portfolio as a "Top Flop" list. Select the "Top Flop" view from the second drop-down list in the upper part of the widget.
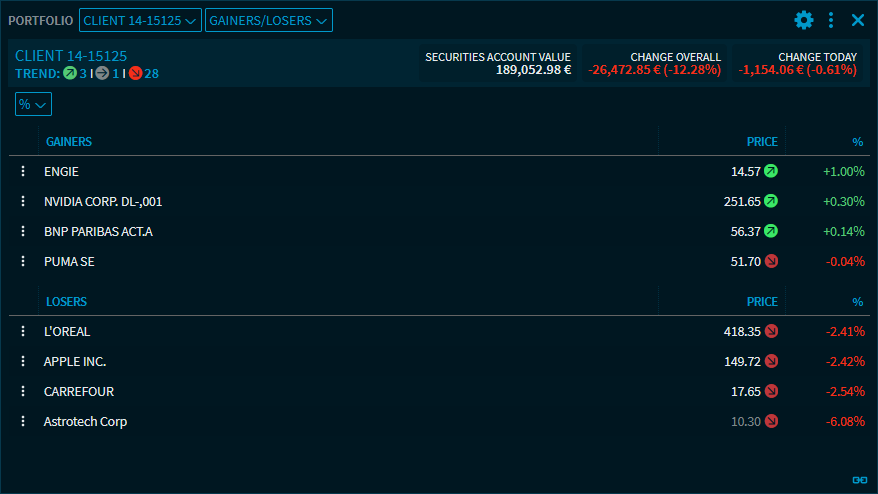
By default, the view shows the 5 greatest risers (top) and 5 greatest fallers (flop). The calculation of the ranking is sorted by the percentage change against the previous day's close ("%" in the drop-down list).
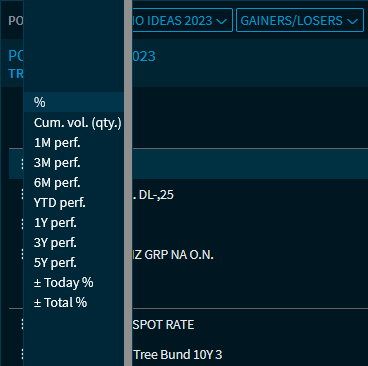
The drop-down list above the risers and fallers allows you to select different criteria like performance intervals or volumes.
The "Gainers/Losers" analysis in the "Portfolio" widget corresponds to the table in the "Gainers/Losers" widget, see Gainers & Losers.
In the "Gainers/Losers" view, you find a menu icon at the start of each security. This icon allows you to quickly open individual securities as a chart or Full Quote.
You can configure the number of instruments to be displayed in the widget settings of this view (from 2 to 20).