Gainers & Losers
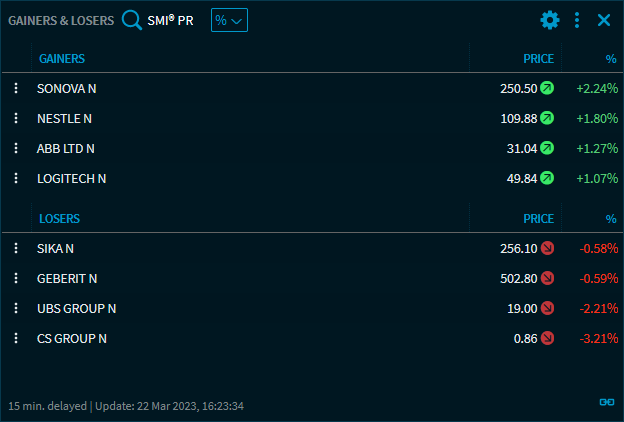
"Gainers & Losers" widget shows the risers and fallers of an equity index at one glance.
In addition to the standard elements, the "Gainers & Losers" widget provides the following elements:
Field | Description |
|---|---|
Select security | Use the integrated quick search to search and select an index. |
Select calculation criterion | By default, the risers and fallers are determined using the percentage change against the previous day's close. Use the second drop-down list next to the security selection list to select from the following criteria:
Only those values are considered that are included in the index.
|
Tops | The security name of the risers. You can change the number of risers and fallers displayed. By default, you see 4 risers and 4 fallers. The list is automatically resorted with each relevant price change so that the largest riser always appears on top of the list. |
Flops | The security name of the fallers. The list is automatically resorted following each relevant price change so that the largest fallers always appears at the bottom of the list. |
Price | The current price of the tops and flops. The colour and direction of the arrow indicates the price change. |
% | The percentage change from the reference value determined based on the current selection of the calculation criterion in the widget. The default setting "%" is the percentage change from the previous day's close. With the "Perf. YTD" setting, it is the percentage change to the start of the year. |
Cum. vol. (qty.) | If you selected the "Volume" calculation criterion, then the "Cum. vol. (qty.)" column is shown instead of the "%" column. The companies with the greatest volume on the current day are shown at the top and those with the smallest volume at the bottom of the list. |
In the Widget Gallery, you find the Gainers & Losers" widget in the "Defaults" section of indices.
"Gainers/Losers" analyses are also available in a Watchlist or the portfolio widget.