"Table" view in the "Risk-Return Matrix" widget
Use the "View" drop-down list to switch between "Chart" and "Table".
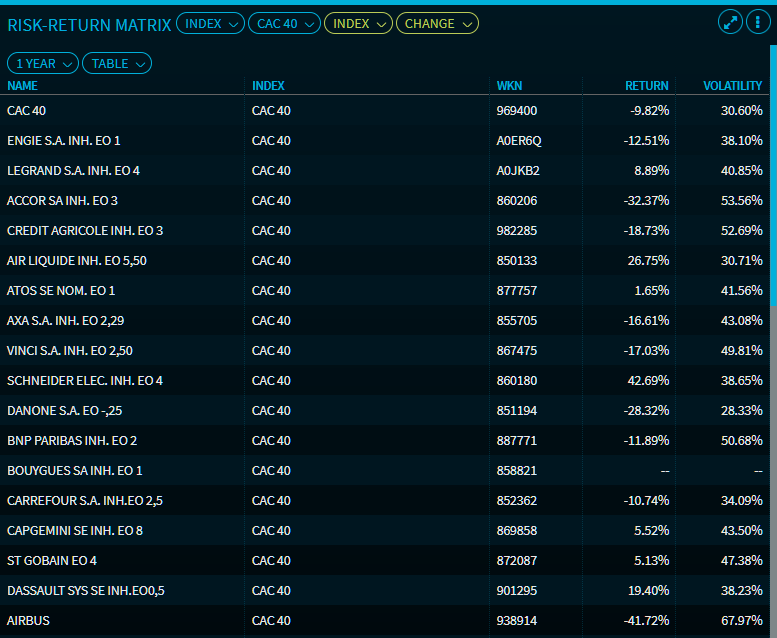
The table shows all securities that are visually displayed in the "Chart" view. The table contains the following columns:
Column | Description |
|---|---|
Name | The name of the security. |
Index | The index selected above. If you selected a watchlist or portfolio instead of an index, the the name of the watchlist or portfolio appears here. If you selected an alternative second index (or watchlist or portfolio), then its securities are added in the table. The "Index" column then shows to which index (or watchlist or portfolio) the security belongs to. |
WKN | The German security ID (WKN) of the security. |
Performance | The relative performance of the selected security in the period selected. |
Volatility | The relative volatility of the security in the period selected. |
If you selected an alternative second index (or watchlist or portfolio), then its securities are added in the table.
Table view with CAC 40 as the first and DAX as the second index
