Key Figure Data (Compass - Shares)

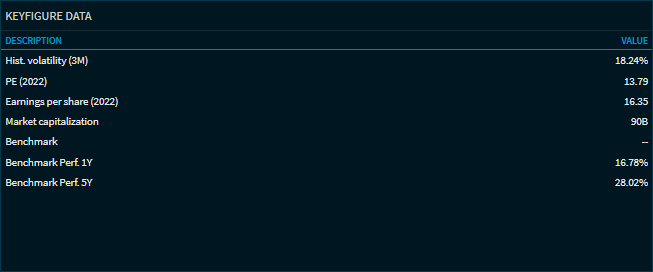
In the Compass widget "Key Figure Data" you will find the following values for shares:
| Field | Description |
|---|---|
| Hist. volatility (3M) | The historical 3-month volatility of the share. |
| P/E ratio (year) | The price/earnings ratio of the share in the year indicated. The price/earnings ratio (P/E ratio) is the ratio of the share price to the earnings per share determined or expected for a comparative period. |
| Earnings per share (year) | Earnings per share in the year stated. This indicator is calculated by dividing the company's consolidated net income (in the period under review) by the average weighted number of shares outstanding during this period. |
| Market capitalisation | The market capitalisation of the company. Market capitalisation (also known as stock market value) is the arithmetical total value of a company's shares in circulation. |
| Benchmark | The benchmark of the share. |
| Benchmark - perf. 1Y | The percentage 1-year performance of the benchmark. |
| Benchmark - perf. 5Y | The percentage 5-year performance of the benchmark. |
