In the ‘Assetmax Portfolio’ widget, you can also display the securities in a portfolio as top flop lists. To do this, select the “Gainers/Losers” view in the view selection.
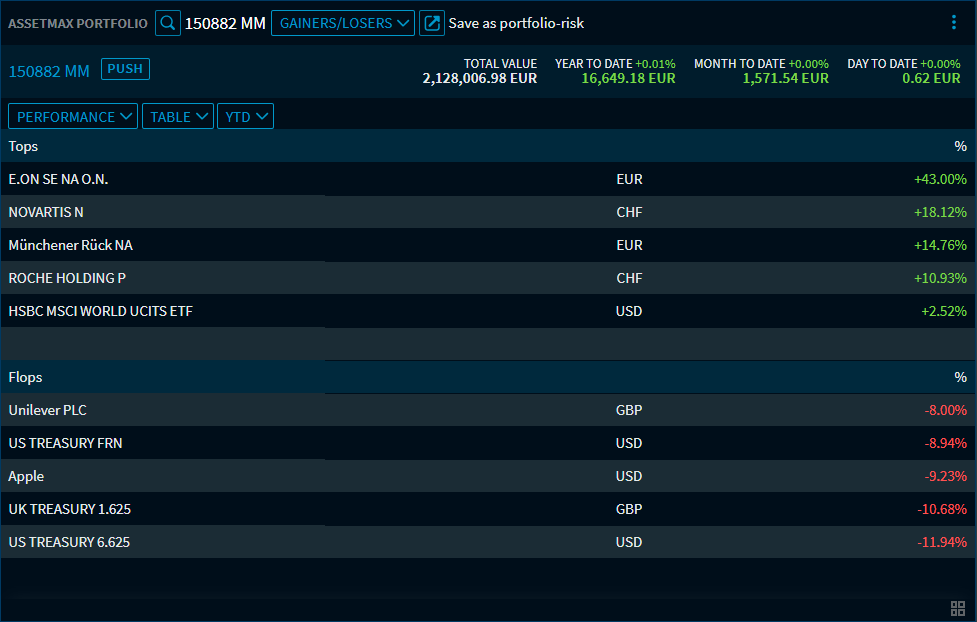
This view shows the 5 biggest winners (“Tops”) and the 5 biggest losers (“Flops”). By default, performance is calculated using the “Percentage change” key figure (column “%”) for the time interval selected in the third selection list above.
Using the first selection list for the tops and flops, you can choose between “Performance” and “Contribution”.
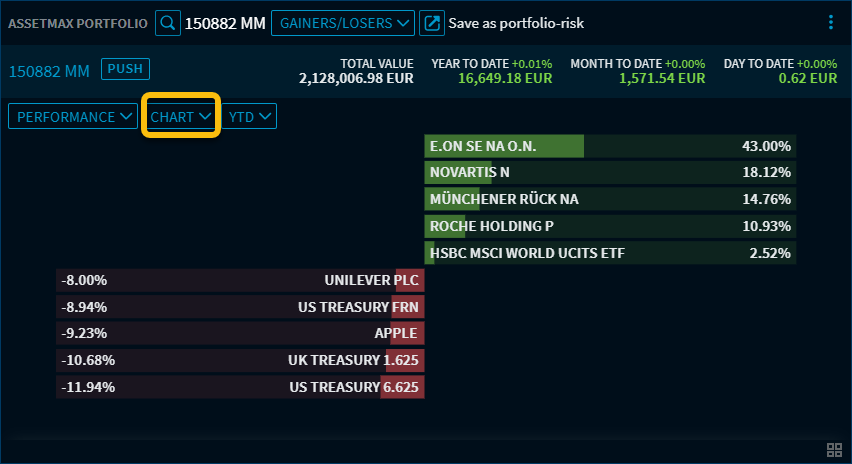
In addition, the second selection list allows you to switch between table and chart views.
Tops and flops as a chart: