Yield Curves view
If you have marked the desired countries in the upper drop-down list “Select country”, the yield curves of the currently selected countries are displayed. You can select up to 6 different countries.
Below this you have the option of selecting several "versions" of the yield curves with different time intervals. To do this, activate the corresponding checkboxes or select a user-defined date via the integrated calendar.
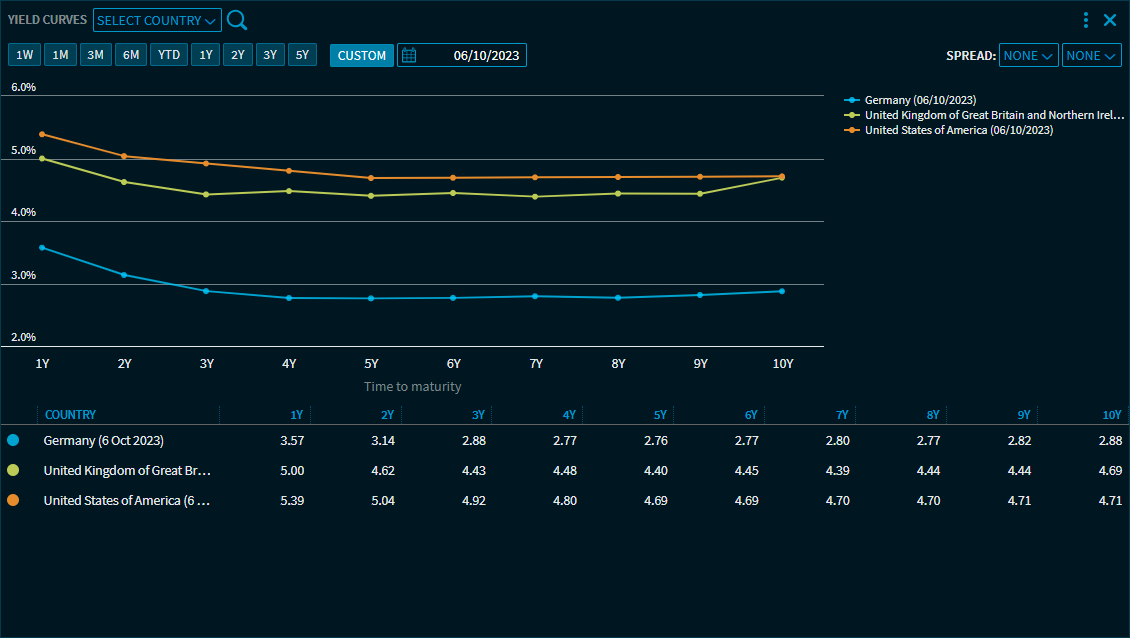
On the x-axis, you see the term of the yield curves in years.
In the legend table below the chart, you see the corresponding values for 1 to 10 annual yields. When you point to a value in the table, it is also highlighted in the chart and vice versa.