Volatility (VOLA)
Type
Volatility indicator
Statement
Volatility is an indicator that quantifies the fluctuations of a value. The higher the fluctuation, the higher the volatility.
Formula/calculation
- Calculation of the MA for the number of periods or observation points
- Determination of the deviation (Close - MA) of each period
- Squaring of the period deviations
- Totalling the squared period deviations
- Divide the sum by the number of observation points
- The standard deviation is then the square root of this value
Interpretation
The faster the prices change, the higher the volatility. The slower prices change, the lower the volatility. It is calculated on the basis of historical rates and can be used to identify trends. It also typically signals when a market is overbought or oversold (that is, the price is disproportionately high or disproportionately low), which may indicate a delay or reversal of the trend.
The volatility does not generate buy or sell signals, but it helps with exit or re-entry strategies.
Default setting
- Observation period: 90 periods
- Extrapolation period: 250 periods
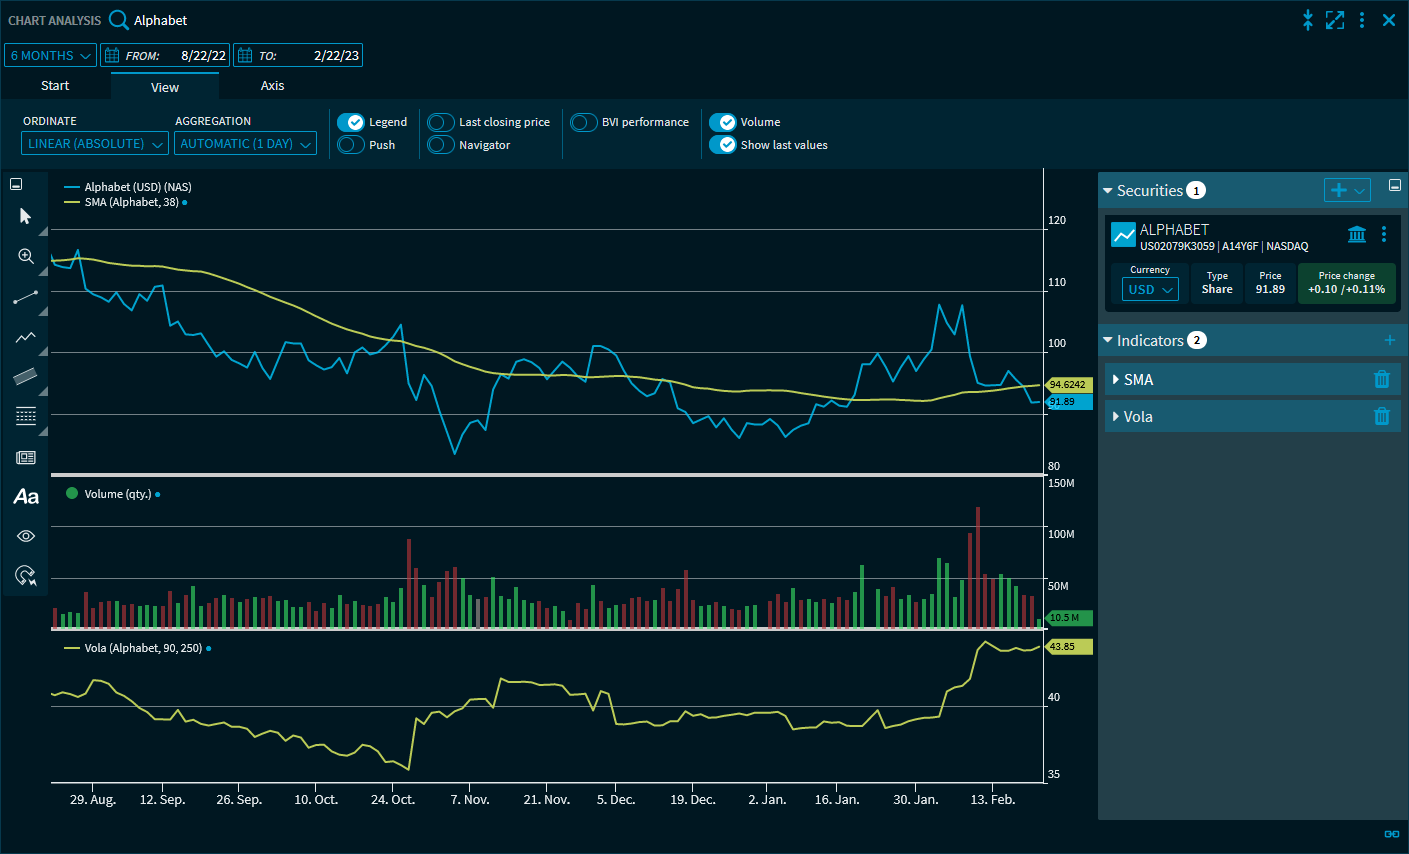
Example: Volatility (VOLA)