theScreener Company Analysis
The widget shows analyses provided by "theScreener" (thescreener.com).
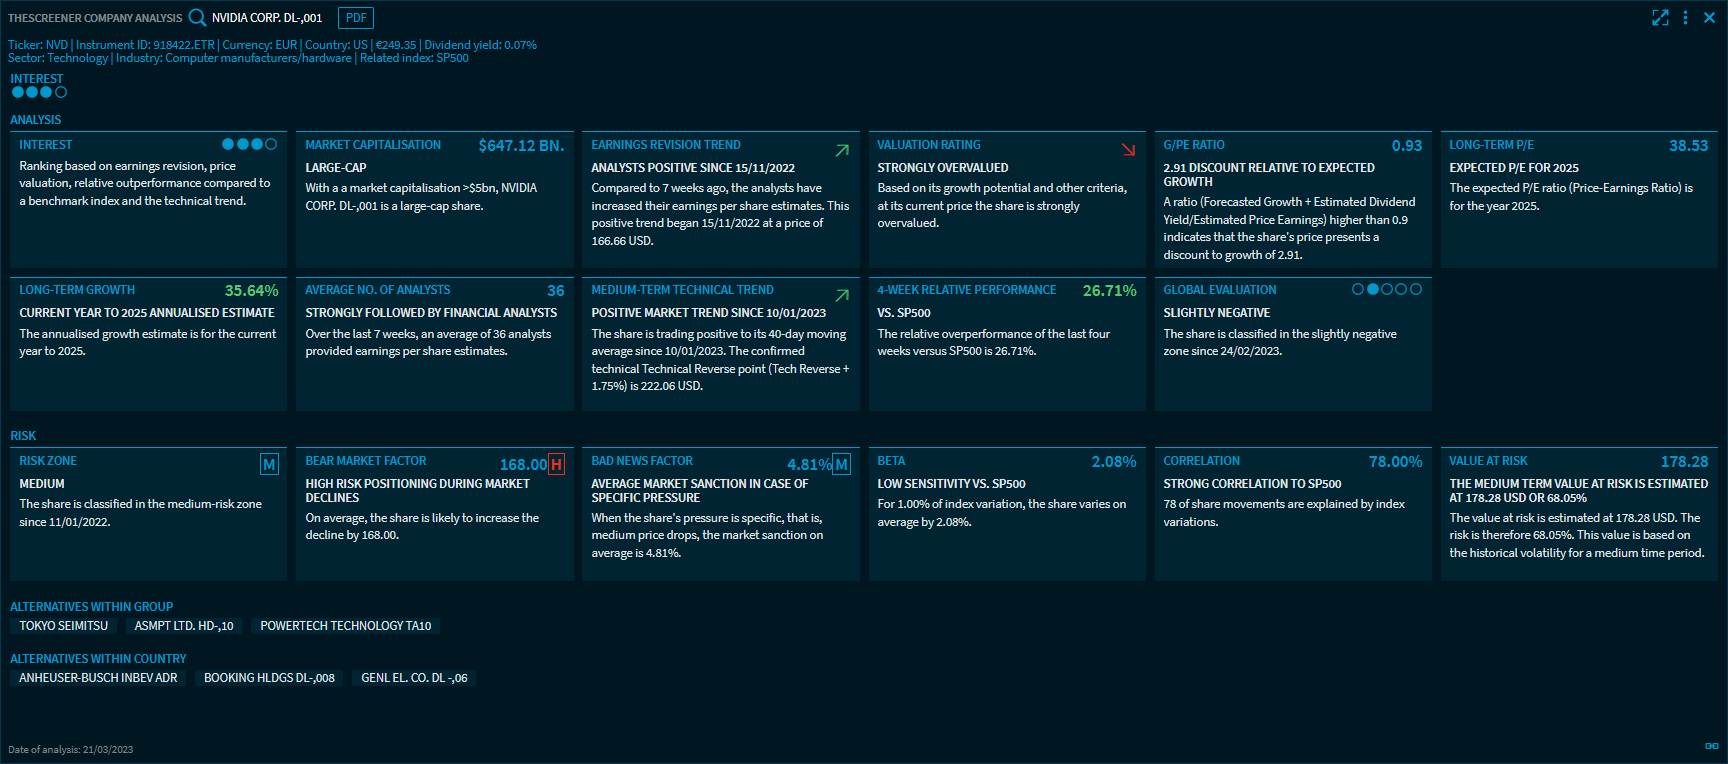
From the security drop-down list, select the share that you want to analyse. The following data are shown directly below:
- Symbol
- Instrument ID
- Currency
- Country
- Current price
- Dividend yield
- Sector
- Industry
- Related index (benchmark)
- Interest
- Analyses and global assessment
- Risk assessment
- Alternatives within group
(Click a security to replace the currently displayed one.) - Alternatives within country
(Click a security to replace the currently displayed one.) - Analysis date (footer)
You can find the following analyses:
Analysis | Description |
|---|---|
Interest | The ranking of the security (from 0 to max. 4 points) is related to earnings revision trends, price valuation and relative outperformance vs. the related index and technical trend. |
Market capitalisation | The value represents the market capitalisation in dollar and the corresponding classification. The value is calculated by multiplying the company's share price by the number of outstanding shares. |
Earnings revision trend | The current analyst estimation including duration and price at the start of this trend. The earnings revision trend is based on the profit forecasts of the analysts. A green arrow indicates that the analysts have significantly raised their earnings estimates in the last 7 weeks (7 week earnings per share estimates > 1%). The red arrow means that the forecasts were significantly lowered in the last 7 weeks (7 week earnings per share estimates < -1%). If the change of the last 7 weeks earnings forecasts is between +1% and -1%, then the trend is classified in the neutral zone. |
Valuation rating | Based on the share's growth potential and other criteria, the valuation shows if the price of a share is currently undervalued or overvalued Most analysts follow the Price/earnings ratio (PE), that is, the ratio of the share price divided by the earnings per share. Generally, the relation is linear. That is, a low P/E usually indicates an undervalued share and a high P/E indicates an overvalued share. |
Growth / P/E Ratio | This is an important indicator in theScreener. This is the estimated growth of future profits (long-term growth) plus the dividend stated in percent, divided by the estimated future price/earnings ratio (P/E). |
Long-term P/E | The estimated P/E for the next year. |
Long-term growth | The estimated annual growth rates until the next year in percent. theScreener points out that high long-term growth forecasts strongly diverging from the growth rates of the corresponding national market indices (or business units) can often be the results of very low profits over the last years. Thus, the company's expected growth rates appear to be very high, but only compared to the previously lean years. |
Average no. of analysts | The average number of analysts indicates how many analyst assessments were used to determine the global estimation. |
Medium-term technical trend | The medium-term (40 days) technical trend including the determined market trend reverse. The medium-term technical trend or market trend indicates the current trend: In theScreener, a positive market trend is regarded as a positive signal, a negative medium-term market trend is regarded as a negative signal. If the performance is between +/-1.75 %, then theScreener regards the medium-term technical trend as neutral. |
Relative performance of last 4 weeks | The relative performance of the share compared to the benchmark. A positive value shows that the share's performance is better than the related benchmark index. A negative value means that the performance of the share is below than that of the corresponding index. |
Global evaluation | The resulting global evaluation: "Negative", "Rather negative", "Neutral", "Rather positive" or "Positive". The global evaluation results from the chance and risk profile as well as the evaluation of the general market environment determined by theScreener. |
In the "Risk" area, you find the following values:
Analysis | Description |
|---|---|
Risk zone | The current (general) risk assessment. The performance of shares is generally subject to high risks (including the risk of total loss) and fluctuations. Even "low-risk" shares are still shares and therefore high-risk investments with a risk of total loss. The rating must be considered solely in relative historic comparison to other shares. Thus, the risk rating has merely statistical significance. Regardless of the rating, every share price can decrease massively at any time. theScreener classifies shares into three risk levels based on their historical behaviour. The share's "Bear market factor" and the "Bad news factor" are compared to a long-term international benchmark (average). |
Bear market factor | The value of the bear market factor and the corresponding evaluation. That is, how strong does the share decline in a sliding period? The "Bear market factor" reflects the performance of a share in declining (bearish) markets. The bear market factor describes the difference between the movements of the share and the movements of the entire market (benchmark index) in declining markets. The "bear market factor" is based on a monitoring period of the past 52 weeks in semi-weekly intervals. For example, if the share price drops by 3% while the entire market declines by just 1%, then the bear market factor is 2%. If the share price declines by just 0.2% while the market declines by 1%, then the bear market factor is 0.8%. A negative value indicates a defensive bear market profile of the share. theScreener derives the following conclusions:
|
Bad news factor | The bad news factor in percent. That is, how strongly does the share price decline if the share's pressure is specific? The bad news factor is based on the analysis of price declines of the share during generally strong markets. This purely mathematical analysis ignores the concrete reasons for price declines. If a share declines absolutely while it's benchmark index rises, then there is some specific pressure acting on the share price (hence the name "bad news factor"). The bad news factor indicates the average deviation of the share in case of a bad news event compared against the benchmark index. The bad news factor is measured semi-weekly in percent and displays the average value of the last 52 weeks. Analysed over several years, the average bad news factor is at about 4%. Values below 4% are classified as defensive. Values above 5.5% are classified as aggressive because in the past they tended to react stronger than the average by one standard deviation. |
Beta | The beta of the share. That is, how strongly does the share price react compared against the index movements of the benchmark? The beta is often used as a measure of risk. It measure the volatility of a share in comparison to the volatility of the entire market (benchmark index). Shares with a beta greater than 100 (display in [%]) are more volatile than their benchmark index. Securities with a beta smaller than 100 usually react less to market movements. |
Correlation | The correlation of the share with the index. How strongly correlated is the volatility of the share with the volatility of the market? The correlation measures the relationship between two variables which change together. The correlation can assume a value between -100% and +100%. The value measures the correlation of a share with its benchmark index over a year. A positive value indicates that the share usually moves with the market. A negative value indicates that the share predominately moved in the opposite direction of the market. |
Value at risk | The estimated value at risk and the resulting risk based on the historical volatility. The "Value at Risk (VaR)" is a risk measure, indicating the loss a certain risk position will not exceed with a specified probability and within a specified time horizon if the historical behaviour does not change significantly. A value at risk of 10 euro with a holding period of 1 day and a confidence level of 97.5% means that the potential loss of the risk position will not exceed 10 euro from one day to the next with a probability of 97.5%. However, it also means that there is a probability of 2.5% that the security will decline significantly, up to a total loss. |
In the Widget Gallery, you find the "theScreener Company Analysis" widget in the "Defaults" section of shares.