Supertrend
Type
Trend indicator
Short introduction
The supertrend indicator is a volatility-based indicator derived from the average true range. This has the advantage that price gaps are included in the calculation of volatility. The indicator also reacts to the volatility of the underlying asset. This means that the supertrend line is further away at a higher volatility than at a lower one. In addition to volatility, the indicator also includes an average price in the calculation.
Statement
The most common use of the supertrend indicator is as a trailing stop loss. As soon as the price has moved in the desired direction, the stop loss self-adjusts to the value of the indicator. Depending on the factor and period, the indicator line is closer to the price or more distant. The advantage of the supertrend is that the indicator adapts to the market. The indicator moves sideways when volatility increases or the price moves in the opposite direction. Thus there is never an extension of the stop loss, but always only a reduction. This reduces the risk in a trade.
Formula/calculation
First, the distance between the high and low price of the current candle is determined. Furthermore, the distance between the closing price of the last candle and the current high and between the closing price of the last candle and the current low is measured. Then these 3 distances are compared with each other. The largest distance (true range) is used for further calculation of the supertrend indicator. The true range is always summed up over exactly as many candles as it is set in the "Period" parameter. The average value is then calculated from this. The result is the average true range ("ATR").
In addition, the simple average price of the current candle is needed to calculate the supertrend indicator.
This is calculated from the formula (High+Low+Close)/3.
The "Multiplier" parameter is used to set how often the ATR is added to or subtracted from the mean rate. If the multiplier is set to "3", the 3-fold ATR is added to the average rate. At the same time, the 3-fold ATR is subtracted from the average exchange rate.
These two calculations produce volatility bands that run above and below all prices on the chart. The supertrend indicator always corresponds to one of these bands: In an upward trend, it corresponds to the lower band, in a downward trend, it corresponds to the upper band.
Interpretation
The "Supertrend" indicator works primarily with market volatility, since the average candlestick span of previous periods is added to or subtracted from the mean value of the individual candles. With a pure supertrend system, the trader is constantly invested.
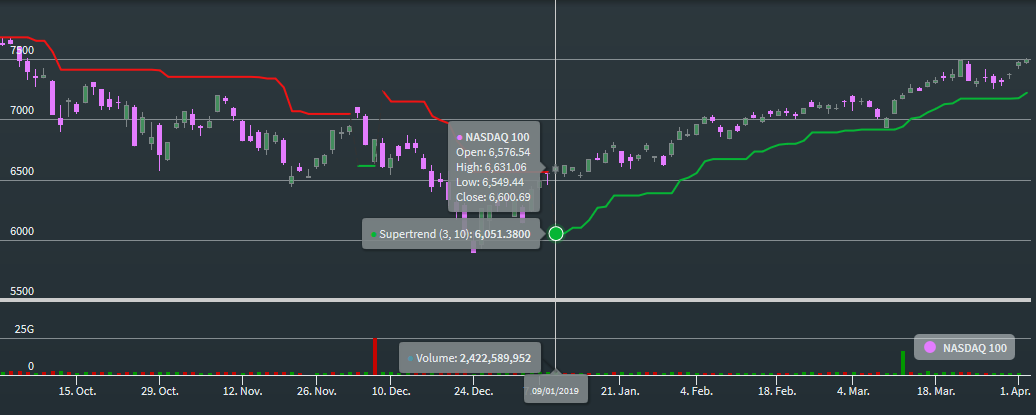
The supertrend indicator does not change its value with smaller price movements in the opposite direction. In upward trends, it can only rise or move horizontally (green chart line in the example). In downward trends, the super trend indicator can only fall or run horizontally (red chart line in the example). The super trend indicator thus behaves like a trailing stop.
Default setting
- Period: 10 periods
- Multiplier: 3
Example: Supertrend