Segment

Use this tool to draw a finite line in the chart. To do this, follow these steps:
- From the "Line" button menu, select the "Segment" entry.
- In the chart, click where you want the line to start and release the mouse button.
- Then, move the mouse pointer to the corresponding location in the chart.
- Finally, double-click to create the end point.
The line is now drawn. You can now select and move it or drag at one of the end points to make it longer or shorter or change the slope.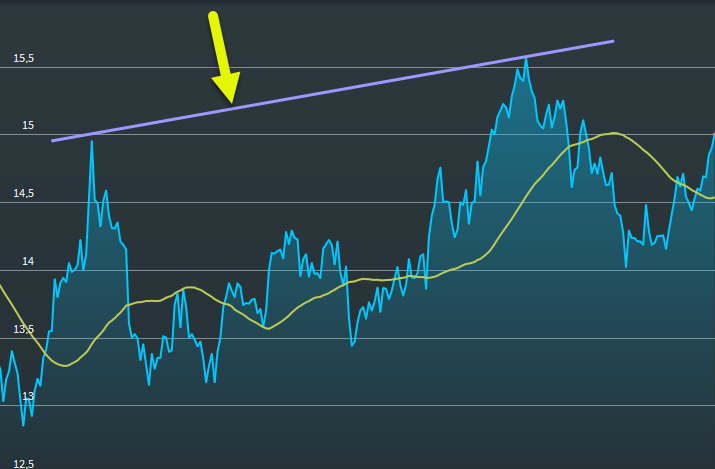
For more information about working with drawing elements, see Edit drawing elements and Delete drawing elements.