Analyst Recommendations
The "Analyst Recommendations" widget shows the current company analyses for a company (that is, its shares).
In the upper left corner, you can select the share. Alternatively, drag and drop a share from a different widget.
In the default view, the following functions and data are available in the "Analyst Recommendations" widget:
Element | Description |
|---|---|
Select security | Use the security selection in the upper left corner to search and select a share. |
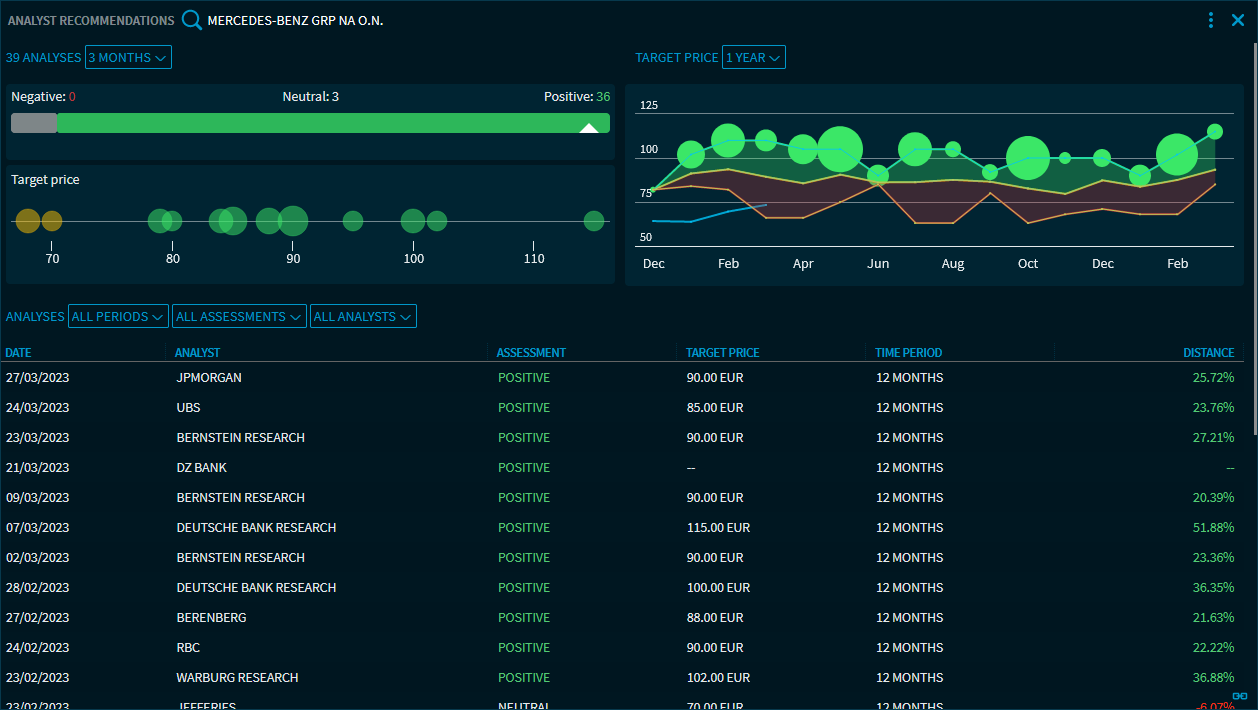
"Analyses" graphic | The graphic on the left visualises all currently filtered analyses as follows: At the top, you see values of the analysis: "Negative" (red), "Neutral" (yellow) or "Positive" (green). You see the number of the corresponding assessments. The arrow shows the average value. Below, you see the target prices from the recommendations. The colour indicates whether the recommendations are positive, neutral or negative. Point to a dot to see the exact target price, the number of recommendations with this target price and the name of the current analyst.
The total number of assessments is shown in the graphic ("33 analyses in the screenshot). Use the drop-down list above the graphic to set the period for the analyses in the graphic. Choose between the following options:
|
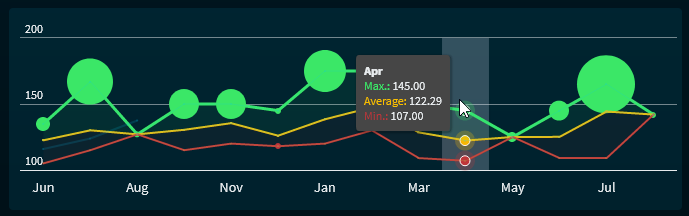
"Target price" graphic | The second graphic (on the right side of the widget) provides more details on the target prices from the analyses. Chart lines are drawn for the maximum, average and minimum monthly values based on the target prices of the recommendations. In addition, the current price of the security is shown. Point to the chart to show the exact values for the month.
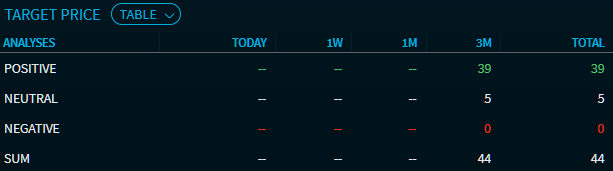
Use the drop-down list above the graphic to switch to the alternative table view. Choose between the following options:
In the table view, the analyses are shown for the following periods:
|
"Period" drop-down list for lists of the analyses | Below the graphics, the individual analyses are listed. You can filter this list by period. To do this, choose between the following values in the period drop-down list:
|
"Assessments" drop-down list for lists of the analyses | Filter the list of analyses by assessment. To do this, choose between the following values in the assessment drop-down list:
|
"Analysts" drop-down list for lists of the analyses | Filter the list of analyses by analyst assessments. To do this, select the relevant analyst from the analyst drop-down list. |
"Date" column | The date of the analyst's assessment. The table is sorted by this column by default, that is, the most recent analyses appear at the top of the table. |
"Analyst" column | The name of the analysts. |
"Judgement" column | The result of the analysis: "Negative" (red), "Neutral" (yellow) or "Positive" (green). |
"Target price" column | The target price from the recommendation. |
"Period" column | The period for the target price determined from the recommendation. |
"Distance" column | The percentage distance of the price to the corresponding target price from the recommendation. |

In the Widget Gallery, you can find the "Analyst Recommendations" widget in the "Other" section of the widgets for shares.