Moving Average Convergence Divergence
Type
Trend indicator
Short introduction
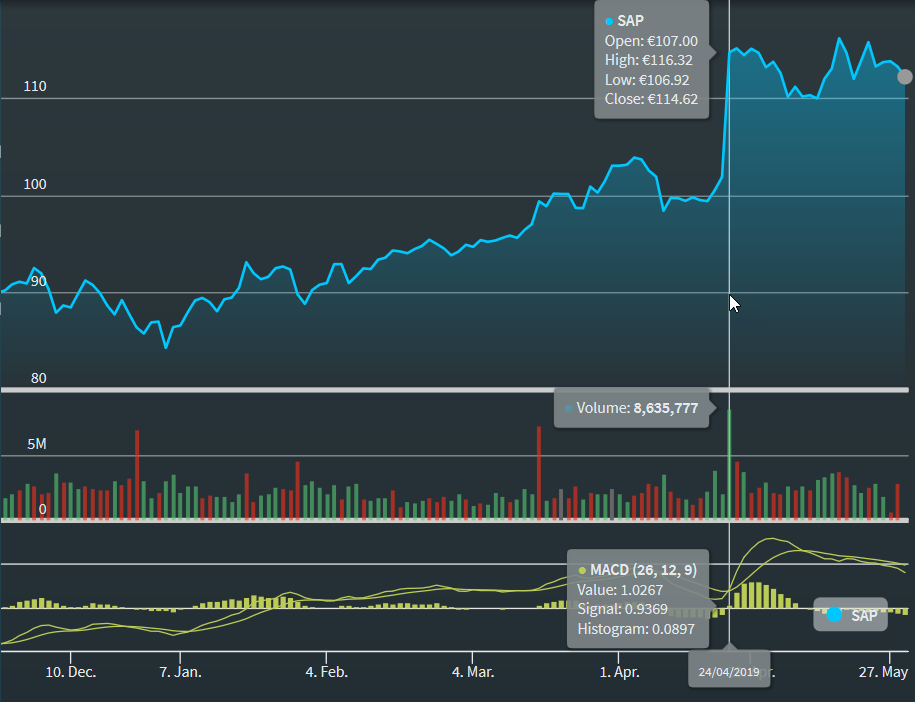
The Moving Average Convergence Divergence Indicator (MACD) has become one of the most widely used technical indicators over the last few years. What is particularly interesting about this indicator is that its calculation and interpretation mean that it can be used in almost any market situation. Therefore, it can be described as a trend follower as well as an oscillator: its basis, 3 MAs, point to its trend-following character.
Statement
The MACD determines the delta of 2 MAs. However, the two MAs are always calculated on an exponential basis. Thus, it oscillates around the zero line. Values crossing above zero are considered bullish, while crossing below zero are bearish.
The convergence/divergence view contained in the name comes to bear by evaluating the distance between the zero line and the MACD curve. The further away the line is from the zero line, the stronger the divergence. A growing divergence indicates an intensification of the prevailing trend, a decrease indicates a weakening of the trend. So the decisive factor is the trend reversal in the MACD line. To get a grip on this, Gerald Appel, the inventor of the MACD, has introduced a second line, an MA of the MACD line. The signals are therefore generated when this line crosses the actual MACD line.
Formula/calculation
MACDt = EMA1t - EMA2t
where:
EMA1t = EMAx (Ct) = EMAt-1 + ((2 ÷ (x + 1)) × (Ct - EMAt-1))
EMA2t = EMAy (Ct) = EMAt-1 + ((2 ÷ (y + 1)) × (Ct - EMAt-1))
Triggert = EMAz (MACDt) = EMAt-1 + ((2 ÷ (z + 1)) × (MACDt - EMAt-1))
Interpretation
A crossing of the MACD line of the trigger up through this line generates a buy signal, a crossing down through this line generates a sell signal. The larger the divergence is or the further away the MACD curve is from the zero line, the signal stronger or more successful the signal.
In addition to this standard use, you can also use the MACD as a simple trend indicator. If the MACD rises, the value is in the uptrend, if it falls, the value is in the downtrend.
A slightly more difficult application is to use the MACD to investigate divergences with the underlying. More difficult because in this case you have to draw your own trend lines to get a result. An example would be the formation of new highs in the underlying, while the highs in the MACD are already falling. In this case, a trend reversal, that is, a fall in the underlying asset, can be expected in the near future.
Default setting
- Actual MACD: 12 an 26 days
- Signal period (trigger line): 9 days
Example: MACD